
Page 157 - Scopus Scholarly Utilisation By Malaysian Public Tertiary Institutions 2020/21
P. 157
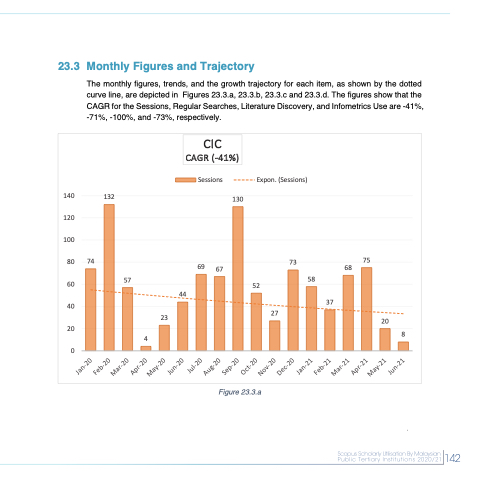
  23.3 Monthly Figures and Trajectory
The monthly figures, trends, and the growth trajectory for each item, as shown by the dotted curve line, are depicted in Figures 23.3.a, 23.3.b, 23.3.c and 23.3.d. The figures show that the CAGR for the Sessions, Regular Searches, Literature Discovery, and Infometrics Use are -41%, -71%, -100%, and -73%, respectively.
   140 120 100
80 74 60
40
20
0
132
130
CIC CAGR (-41%)
Sessions
Expon. (Sessions)
      73
68 75
  57
4
23
44
69
67
27
37
         52
58
       20
8
   Figure 23.3.a
 142
 142
 Jan-20 Feb-20
Mar-20 Apr-20
May-20 Jun-20
Jul-20 Aug-20
Sep-20 Oct-20
Nov-20 Dec-20
Jan-21 Feb-21
Mar-21 Apr-21
May-21 Jun-21
