
Page 31 - Scopus Scholarly Utilisation By Malaysian Public Tertiary Institutions 2020/21
P. 31
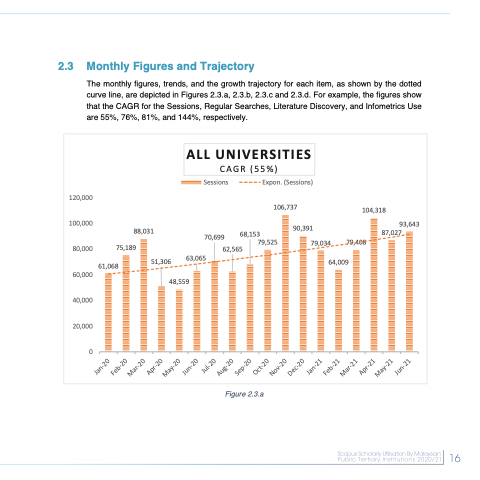
  2.3 Monthly Figures and Trajectory
The monthly figures, trends, and the growth trajectory for each item, as shown by the dotted curve line, are depicted in Figures 2.3.a, 2.3.b, 2.3.c and 2.3.d. For example, the figures show that the CAGR for the Sessions, Regular Searches, Literature Discovery, and Infometrics Use are 55%, 76%, 81%, and 144%, respectively.
   120,000 100,000 80,000 60,000 40,000 20,000 0
88,031 75,189
70,699 68,153
106,737 90,391
104,318
87,02793,643 79,408
61,068
51,306 63,065 48,559
ALL UNIVERSITIES
CAGR (55%)
Sessions Expon. (Sessions)
  62,565
79,525
79,034 64,009
                    Figure 2.3.a
 16
 16
 Jan-20 Feb-20
Mar-20 Apr-20
May-20 Jun-20
Jul-20 Aug-20
Sep-20 Oct-20
Nov-20 Dec-20
Jan-21 Feb-21
Mar-21 Apr-21
May-21 Jun-21
