
Page 36 - Scopus Scholarly Utilisation By Malaysian Public Tertiary Institutions 2020/21
P. 36
21
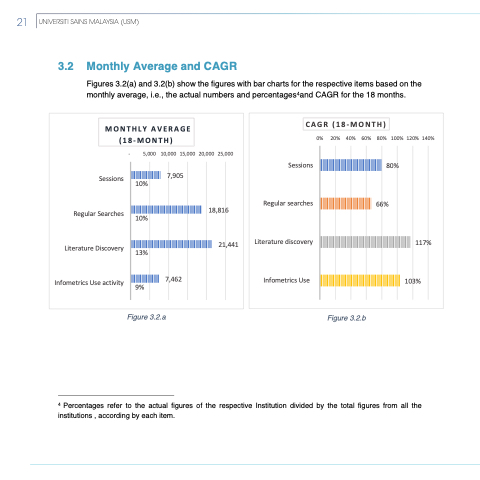
3.2 Monthly Average and CAGR
Figures 3.2(a) and 3.2(b) show the figures with bar charts for the respective items based on the monthly average, i.e., the actual numbers and percentages4and CAGR for the 18 months.
CAGR (18-MONTH)
Sessions Regular searches Literature discovery
Infometrics Use
0% 20% 40% 60% 80% 100% 120% 140% 80%
66%
117%
103%
MONTHLY AVERAGE (18-MONTH)
-
5,000 10,000 15,000 20,000 25,000 7,905
Sessions Regular Searches Literature Discovery Infometrics Use activity
18,816 21,441
10%
10%
13%
7,462 9%
Figure 3.2.a
Figure 3.2.b
4 Percentages refer to the actual figures of the respective Institution divided by the total figures from all the institutions , according by each item.
21
UNIVERSITI SAINS MALAYSIA (USM)
