
Page 37 - Scopus Scholarly Utilisation By Malaysian Public Tertiary Institutions 2020/21
P. 37
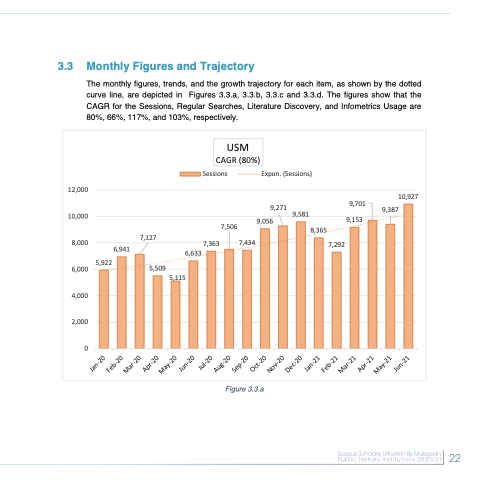
  3.3 Monthly Figures and Trajectory
The monthly figures, trends, and the growth trajectory for each item, as shown by the dotted curve line, are depicted in Figures 3.3.a, 3.3.b, 3.3.c and 3.3.d. The figures show that the CAGR for the Sessions, Regular Searches, Literature Discovery, and Infometrics Usage are 80%, 66%, 117%, and 103%, respectively.
   12,000 10,000 8,000 6,000 4,000 2,000 0
Sessions
7,506
Expon. (Sessions)
9,271
9,056 9,581
9,701 9,153
10,927 9,387
USM CAGR (80%)
          7,127 7,363 6,633
5,509
5,115
8,365
  6,941
7,434
7,292
      5,922
                           Figure 3.3.a
 22
 22
 Jan-20 Feb-20
Mar-20 Apr-20
May-20 Jun-20
Jul-20 Aug-20
Sep-20 Oct-20
Nov-20 Dec-20
Jan-21 Feb-21
Mar-21 Apr-21
May-21 Jun-21
