
Page 43 - Scopus Scholarly Utilisation By Malaysian Public Tertiary Institutions 2020/21
P. 43
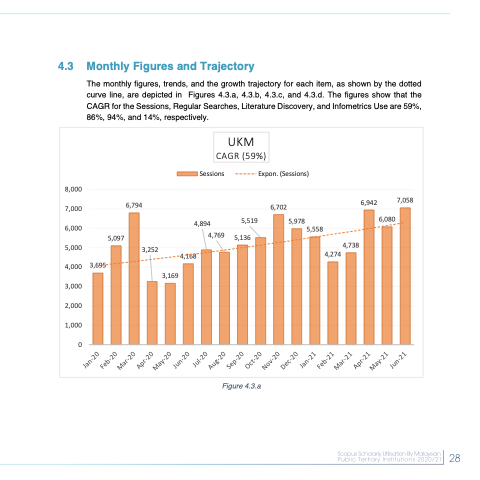
  4.3 Monthly Figures and Trajectory
The monthly figures, trends, and the growth trajectory for each item, as shown by the dotted curve line, are depicted in Figures 4.3.a, 4.3.b, 4.3.c, and 4.3.d. The figures show that the CAGR for the Sessions, Regular Searches, Literature Discovery, and Infometrics Use are 59%, 86%, 94%, and 14%, respectively.
   8,000 7,000 6,000
6 794
6,942
7,058
,
3,252
Sessions
Expon. (Sessions)
6 702
          5,097 5,000
4,000 3,695 3,000
2,000
1,000
0
            3,169
4,894
5,519
5,978
5,558
4,738
4,769 4,168
5,136
UKM CAGR (59%)
,
4,274
6,080
       Figure 4.3.a
 28
 28
 Jan-20 Feb-20
Mar-20 Apr-20
May-20 Jun-20
Jul-20 Aug-20
Sep-20 Oct-20
Nov-20 Dec-20
Jan-21 Feb-21
Mar-21 Apr-21
May-21 Jun-21
