
Page 48 - Scopus Scholarly Utilisation By Malaysian Public Tertiary Institutions 2020/21
P. 48
33
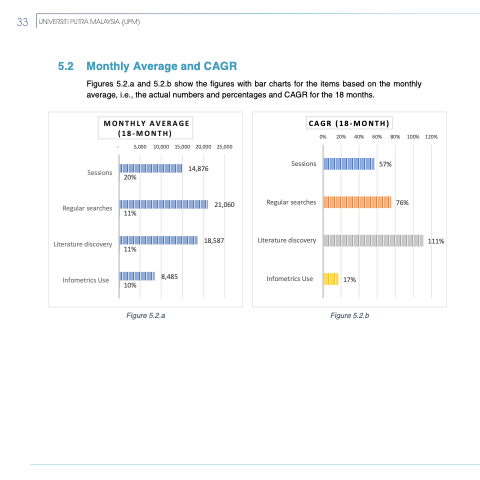
5.2 Monthly Average and CAGR
Figures 5.2.a and 5.2.b show the figures with bar charts for the items based on the monthly average, i.e., the actual numbers and percentages and CAGR for the 18 months.
CAGR (18-MONTH)
0%
20% 40%
60% 80% 100% 120% 57%
Sessions Regular searches Literature discovery
Infometrics Use
76%
111%
17%
Figure 5.2.b
MONTHLY AVERAGE (18-MONTH)
-
5,000 10,000 15,000 20,000 25,000 14,876
Sessions Regular searches Literature discovery
Infometrics Use
21,060 18,587
20%
11%
11%
8,485 10%
Figure 5.2.a
33
UNIVERSITI PUTRA MALAYSIA (UPM)
