
Page 49 - Scopus Scholarly Utilisation By Malaysian Public Tertiary Institutions 2020/21
P. 49
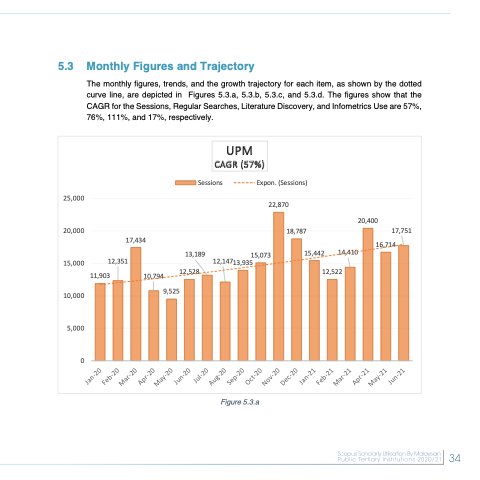
  5.3 Monthly Figures and Trajectory
The monthly figures, trends, and the growth trajectory for each item, as shown by the dotted curve line, are depicted in Figures 5.3.a, 5.3.b, 5.3.c, and 5.3.d. The figures show that the CAGR for the Sessions, Regular Searches, Literature Discovery, and Infometrics Use are 57%, 76%, 111%, and 17%, respectively.
   25,000 20,000 15,000 10,000
5,000 0
20,400
Sessions
Expon. (Sessions)
22,870 18,787
UPM CAGR (57%)
     17,434 12,351
13,189 12,14713,93515,073 12,528
15,442
14,410
17,751 16,714
       12,522
  11,903
10,794 9,525
           Figure 5.3.a
 34
 34
 Jan-20 Feb-20
Mar-20 Apr-20
May-20 Jun-20
Jul-20 Aug-20
Sep-20 Oct-20
Nov-20 Dec-20
Jan-21 Feb-21
Mar-21 Apr-21
May-21 Jun-21
