
Page 67 - Scopus Scholarly Utilisation By Malaysian Public Tertiary Institutions 2020/21
P. 67
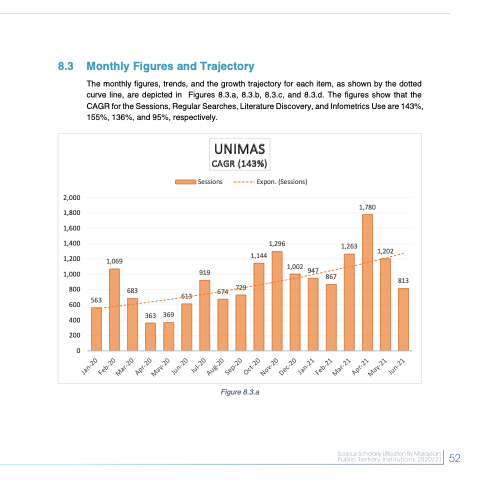
  8.3 Monthly Figures and Trajectory
The monthly figures, trends, and the growth trajectory for each item, as shown by the dotted curve line, are depicted in Figures 8.3.a, 8.3.b, 8.3.c, and 8.3.d. The figures show that the CAGR for the Sessions, Regular Searches, Literature Discovery, and Infometrics Use are 143%, 155%, 136%, and 95%, respectively.
   2,000 1,800 1,600 1,400 1,200 1,000
  800
  600
  400
  200
0
1,780
Sessions
Expon. (Sessions)
     1,296
1,263
813
 1,144 674 729
1,202
  1,069
   919
        563
683 613
      363 369
UNIMAS CAGR (143%)
1,002 947 867
     Figure 8.3.a
 52
 52
 Jan-20 Feb-20
Mar-20 Apr-20
May-20 Jun-20
Jul-20 Aug-20
Sep-20 Oct-20
Nov-20 Dec-20
Jan-21 Feb-21
Mar-21 Apr-21
May-21 Jun-21
