
Page 79 - Scopus Scholarly Utilisation By Malaysian Public Tertiary Institutions 2020/21
P. 79
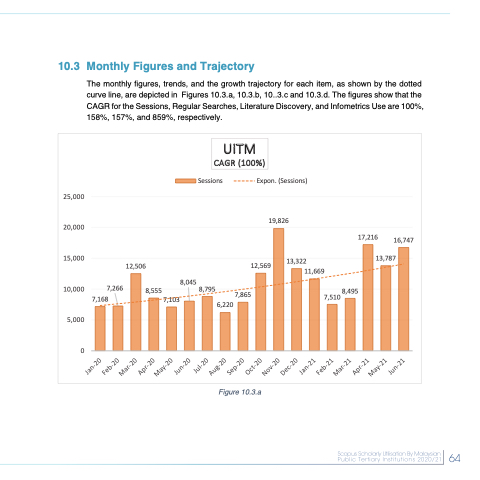
  10.3 Monthly Figures and Trajectory
The monthly figures, trends, and the growth trajectory for each item, as shown by the dotted curve line, are depicted in Figures 10.3.a, 10.3.b, 10..3.c and 10.3.d. The figures show that the CAGR for the Sessions, Regular Searches, Literature Discovery, and Infometrics Use are 100%, 158%, 157%, and 859%, respectively.
   25,000 20,000 15,000 10,000
5,000 0
17,216 13,787
Sessions
Expon. (Sessions)
19,826
12,569 13,322 11,669
UiTM CAGR (100%)
    16,747
        7,266 7,168
12,506 8,555
8,045 8,795
7,865 7,510 8,495
 7,103
6,220
            Figure 10.3.a
 64
 64
 Jan-20 Feb-20
Mar-20 Apr-20
May-20 Jun-20
Jul-20 Aug-20
Sep-20 Oct-20
Nov-20 Dec-20
Jan-21 Feb-21
Mar-21 Apr-21
May-21 Jun-21
