
Page 85 - Scopus Scholarly Utilisation By Malaysian Public Tertiary Institutions 2020/21
P. 85
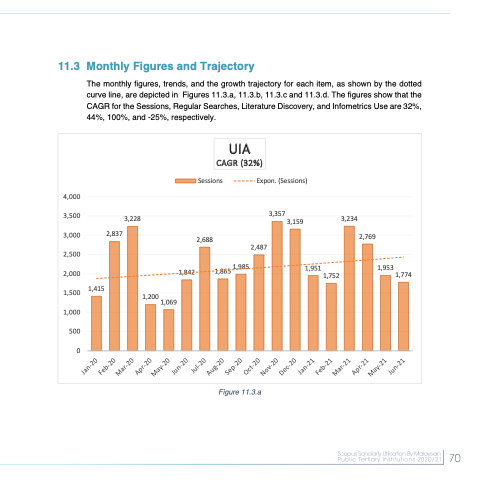
  11.3 Monthly Figures and Trajectory
The monthly figures, trends, and the growth trajectory for each item, as shown by the dotted curve line, are depicted in Figures 11.3.a, 11.3.b, 11.3.c and 11.3.d. The figures show that the CAGR for the Sessions, Regular Searches, Literature Discovery, and Infometrics Use are 32%, 44%, 100%, and -25%, respectively.
   4,000
3,500
3,000
2,500
2,000
1,500 1,415
1,000 500 0
3,228
3,234
Sessions
Expon. (Sessions)
3,357 3,159
      2,837
2,769
1,953 1,774
               1,200 1,069
1,842
UIA CAGR (32%)
2,688
2,487
1,865 1,985
1,951 1,752
       Figure 11.3.a
 70
 70
 Jan-20 Feb-20
Mar-20 Apr-20
May-20 Jun-20
Jul-20 Aug-20
Sep-20 Oct-20
Nov-20 Dec-20
Jan-21 Feb-21
Mar-21 Apr-21
May-21 Jun-21
