
Page 23 - Leaving No One Behind in The Gambia - Inequalityof Opportunity Gambia
P. 23
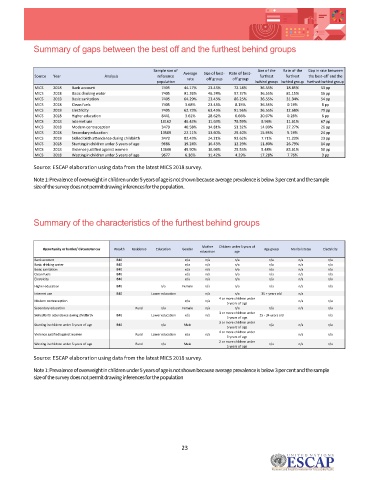
Summary of gaps between the best off and the furthest behind groups


                                                    Sample size of   Average   Size of best-  Rate of best-  Size of the   Rate of the   Gap in rate between
            Source  Year            Analysis         reference   rate  off group  off group  furthest   furthest   the best-off and the
                                                     population                       behind group behind group furthest behind group
            MICS   2018  Bank account                 7405    44.17%  23.45%  72.18%   36.55%   18.85%     53 pp
            MICS   2018  Basic drinking water         7405    91.26%  46.24%  97.37%   36.55%   81.15%     16 pp
            MICS   2018  Basic sanitation             7405    64.29%  23.45%  86.25%   36.55%   31.94%     54 pp
            MICS   2018  Clean fuels                  7405    3.68%   23.45%   8.15%   36.55%   0.19%      8 pp
            MICS   2018  Electricity                  7405    62.73%  63.45%  91.56%   36.55%   12.68%     79 pp
            MICS   2018  Higher education             8441    3.61%   28.62%   6.66%   20.07%   0.26%      6 pp
            MICS   2018  Internet use                 18162   46.43%  11.63%  78.59%   8.96%    11.61%     67 pp
            MICS   2018  Modern contraception         3479    40.58%  14.81%  53.32%   14.00%   27.27%     26 pp
            MICS   2018  Secondary education          13509   22.11%  33.60%  29.40%   15.95%   5.19%      24 pp
            MICS   2018  Skilled birth attendance during childbirth  3472  82.43%  24.21%  93.62%  7.71%  71.23%  23 pp
            MICS   2018  Stunting in children under 5 years of age  9686  19.24%  16.43%  12.29%  11.80%  26.79%  14 pp
            MICS   2018  Violence justified against women  13640  49.90%  18.66%  25.53%  5.48%  83.61%    58 pp
            MICS   2018  Wasting in children under 5 years of age  9677  6.36%  11.42%  4.29%  17.28%  7.76%  3 pp

            Source: ESCAP elaboration using data from the latest MICS 2018 survey.
            Note 1: Prevalence of overweight in children under 5 years of age is not shown because average prevalence is below 3 per cent and the sample
            size of the survey does not permit drawing inferences for the population.


            Summary of the characteristics of the furthest behind groups


                                                                    Mother   Children under 5 years of
               Opportunity or barrier/ Circumstances  Wealth  Residence  Education  Gender  Age group  Marital status  Electricity
                                                                   education   age
            Bank account                B40                   n/a    n/a       n/a        n/a       n/a       n/a
            Basic drinking water        B40                   n/a    n/a       n/a        n/a       n/a       n/a
            Basic sanitation            B40                   n/a    n/a       n/a        n/a       n/a       n/a
            Clean fuels                 B40                   n/a    n/a       n/a        n/a       n/a       n/a
            Electricity                 B40                   n/a    n/a       n/a        n/a       n/a       n/a
            Higher education            B40           n/a    Female  n/a       n/a        n/a       n/a       n/a
            Internet use                B40        Lower education   n/a       n/a      35 + years old  n/a
                                                                          4 or more children under
            Modern contraception                              n/a    n/a                            n/a       n/a
                                                                            5 years of age
            Secondary education               Rural   n/a    Female  n/a       n/a        n/a       n/a       n/a
                                                                          3 or more children under
            Skilled birth attendance during childbirth  B40  Lower education  n/a  n/a  25 - 34 years old     n/a
                                                                            5 years of age
                                                                          3 or more children under
            Stunting in children under 5 years of age  B40  n/a  Male                     n/a       n/a       n/a
                                                                            5 years of age
                                                                          4 or more children under
            Violence justified against women  Rural  Lower education  n/a  n/a                      n/a       n/a
                                                                            5 years of age
                                                                          2 or more children under
            Wasting in children under 5 years of age  Rural  n/a  Male                    n/a       n/a       n/a
                                                                            5 years of age
            Source: ESCAP elaboration using data from the latest MICS 2018 survey.
            Note 1: Prevalence of overweight in children under 5 years of age is not shown because average prevalence is below 3 per cent and the sample
            size of the survey does not permit drawing inferences for the population


                                                             23