Page 41 - 2015WellBeing
P. 41
our economy 41
Mode of Transportation
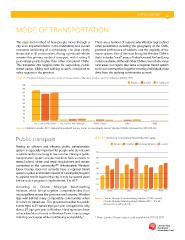
The ease and method of how people move through a There are a number of reasons why Windsor lags behind
city is an important factor in the habitability and overall other jurisdictions including the geography of the CMA,
economic well-being of a community. The data clearly personal preferences of workers, and the capacity of the
shows that in all communities, driving a personal vehicle transit system. Part of the issue facing the Windsor CMA is
remains the primary mode of transport, with it rating 5 that it includes “rural” areas of Lakeshore and Amherstburg
percentage points higher than other compared CMAs. in its boundaries. Although other CMAs may include some
This translates into lagging rates for carpooling, public rural areas our region also lacks a regional transit system
transit usage, biking and walking to work, compared to to tie our communities together meaning individuals must
other regions in the province. drive from the outlying communities to work.
Chart 40: E mployed labour force by mode of transportation, Windsor, London and St Catharines (CMA), 2011
100 Windsor London St Catherines
90
80 Public Transit Bike Walk
70
60
50
40
30
20
10
0
Car, Truck or Van Driver Car, Truck or Van Passenger
Source: S tatistics Canada, 2011 National Household Survey, Focus on Geography Series, Windsor (CMA) (Accessed on 2015-04-02)
Public transport Chart 41: N umber of Conventional Transit Trips Per Capita
Windsor Hamilton Kitchener-Waterloo London*
Having an efficient and effective public transportation
system is especially important for people who do not own 70 2011 2012 2013
a vehicle and/or are living in low income. Having a public 60
transportation system ensures residents have a means to 50
attend school, obtain and retain employment and remain 40
connected to the community.xlviii Unfortunately Windsor- 30
Essex County does not currently have a regional transit 20
system in place and despite reports of a local pilot program 10
to expand transit beyond the city, it may be several years 0 2010
before such a program is implemented, if at all.xlix
Source: O ntario Municipal Benchmarking Initiative (2014) Transit &
According to Ontario Municipal Benchmarking Ontario Municipal Benchmarking Initiative 2013 - Transit.
Initiative, which brings together comparable data from (Accessed on 2015-04-10).*
municipalities across the province and country, Windsor
lags well behind many comparable communities when * Note: London Ontario data is only available for 2010 & 2011
it comes to transit use. The provincial median for public
transit trips is 39 transit trips per year compared to only
about 30 trips per year in Windsor. Hard questions have
to be asked about transit in Windsor-Essex to encourage
ridership and usage while maintaining accessibility.l
Mode of Transportation
The ease and method of how people move through a There are a number of reasons why Windsor lags behind
city is an important factor in the habitability and overall other jurisdictions including the geography of the CMA,
economic well-being of a community. The data clearly personal preferences of workers, and the capacity of the
shows that in all communities, driving a personal vehicle transit system. Part of the issue facing the Windsor CMA is
remains the primary mode of transport, with it rating 5 that it includes “rural” areas of Lakeshore and Amherstburg
percentage points higher than other compared CMAs. in its boundaries. Although other CMAs may include some
This translates into lagging rates for carpooling, public rural areas our region also lacks a regional transit system
transit usage, biking and walking to work, compared to to tie our communities together meaning individuals must
other regions in the province. drive from the outlying communities to work.
Chart 40: E mployed labour force by mode of transportation, Windsor, London and St Catharines (CMA), 2011
100 Windsor London St Catherines
90
80 Public Transit Bike Walk
70
60
50
40
30
20
10
0
Car, Truck or Van Driver Car, Truck or Van Passenger
Source: S tatistics Canada, 2011 National Household Survey, Focus on Geography Series, Windsor (CMA) (Accessed on 2015-04-02)
Public transport Chart 41: N umber of Conventional Transit Trips Per Capita
Windsor Hamilton Kitchener-Waterloo London*
Having an efficient and effective public transportation
system is especially important for people who do not own 70 2011 2012 2013
a vehicle and/or are living in low income. Having a public 60
transportation system ensures residents have a means to 50
attend school, obtain and retain employment and remain 40
connected to the community.xlviii Unfortunately Windsor- 30
Essex County does not currently have a regional transit 20
system in place and despite reports of a local pilot program 10
to expand transit beyond the city, it may be several years 0 2010
before such a program is implemented, if at all.xlix
Source: O ntario Municipal Benchmarking Initiative (2014) Transit &
According to Ontario Municipal Benchmarking Ontario Municipal Benchmarking Initiative 2013 - Transit.
Initiative, which brings together comparable data from (Accessed on 2015-04-10).*
municipalities across the province and country, Windsor
lags well behind many comparable communities when * Note: London Ontario data is only available for 2010 & 2011
it comes to transit use. The provincial median for public
transit trips is 39 transit trips per year compared to only
about 30 trips per year in Windsor. Hard questions have
to be asked about transit in Windsor-Essex to encourage
ridership and usage while maintaining accessibility.l