Page 62 - 2015WellBeing
P. 62
Our Safety
Crimes against People and Property
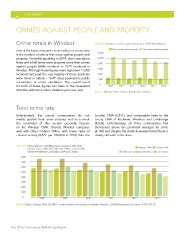
Crime totals in Windsor Chart 58: Number of crimes against the person, 2009-2014, Windsor
One of the basic measures of criminality in a community Total crimes against people Total crime against property
is the number of crimes that occur against people and
property. Generally speaking in 2014, there was about 12,000
three and a half times more property crime than crimes
against people (8686 incidents vs 2344 incidents) in 10,000
Windsor. Although these figures seem high (over 11,000
incidents last year) the vast majority of these incidents 8,000
were minor in nature – “soft” drug possession, public
intoxication or minor vandalism. The overall trend 6,000
for both of these figures has been in the downward
direction with some minor variation year over year. 4,000
2,000
0 2009 2010 2011 2012 2013 2014
Source: W indsor Police Services. (2014) Crime Statistics.
Total crime rate London CMA (5,811), and comparable rates to the
tri-city CMA of Kitchener, Waterloo and Cambridge
Unfortunately the county communities do not (4,838). Unfortunately, all three communities find
readily publish local crime statistics and as a result themselves above the provincial averages for crime
the remainder of this section generally focuses (4,183) and despite the slight downward trend there is
on the Windsor CMA. Overall, Windsor compares clearly still work to be done.
well with other Ontario CMAs, with lower rates of
criminal activity (4,872 per 100,000 in 2013) than the
Chart 59: C rime rates per 100,000 people compared with other Windsor CMA London CMA
Ontario Cities, 2008-2013, Windsor CMA, London CMA, Kitchener-Cambridge-Waterloo CMA Ontario
Kitchener-Waterloo-Cambridge CMA and Ontario.
8,000
7,000
6,000
5,000
4,000
3,000
2,000
1,000
0 2008 2009 2010 2011 2012 2013
Source: Statistics Canada. Table 252-0051 - Incident-based crime statistics, by detailed violations. CANSIM (database). (Accessed on 2015-04-13)
The 2015 Community Well-Being Report
Crimes against People and Property
Crime totals in Windsor Chart 58: Number of crimes against the person, 2009-2014, Windsor
One of the basic measures of criminality in a community Total crimes against people Total crime against property
is the number of crimes that occur against people and
property. Generally speaking in 2014, there was about 12,000
three and a half times more property crime than crimes
against people (8686 incidents vs 2344 incidents) in 10,000
Windsor. Although these figures seem high (over 11,000
incidents last year) the vast majority of these incidents 8,000
were minor in nature – “soft” drug possession, public
intoxication or minor vandalism. The overall trend 6,000
for both of these figures has been in the downward
direction with some minor variation year over year. 4,000
2,000
0 2009 2010 2011 2012 2013 2014
Source: W indsor Police Services. (2014) Crime Statistics.
Total crime rate London CMA (5,811), and comparable rates to the
tri-city CMA of Kitchener, Waterloo and Cambridge
Unfortunately the county communities do not (4,838). Unfortunately, all three communities find
readily publish local crime statistics and as a result themselves above the provincial averages for crime
the remainder of this section generally focuses (4,183) and despite the slight downward trend there is
on the Windsor CMA. Overall, Windsor compares clearly still work to be done.
well with other Ontario CMAs, with lower rates of
criminal activity (4,872 per 100,000 in 2013) than the
Chart 59: C rime rates per 100,000 people compared with other Windsor CMA London CMA
Ontario Cities, 2008-2013, Windsor CMA, London CMA, Kitchener-Cambridge-Waterloo CMA Ontario
Kitchener-Waterloo-Cambridge CMA and Ontario.
8,000
7,000
6,000
5,000
4,000
3,000
2,000
1,000
0 2008 2009 2010 2011 2012 2013
Source: Statistics Canada. Table 252-0051 - Incident-based crime statistics, by detailed violations. CANSIM (database). (Accessed on 2015-04-13)
The 2015 Community Well-Being Report