
Page 46 - Ramanujan Yatra
P. 46
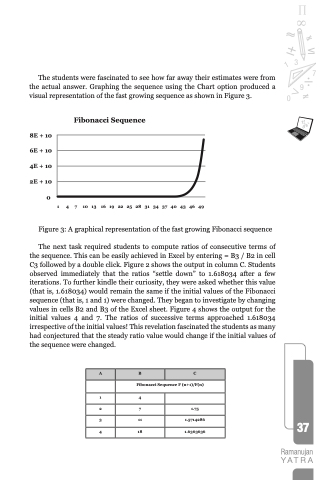
           The students were fascinated to see how far away their estimates were from the actual answer. Graphing the sequence using the Chart option produced a visual representation of the fast growing sequence as shown in Figure 3.
     Fibonacci Sequence
       8E + 10 6E + 10 4E + 10 2E + 10
0
 1 4 7
10 13
16 19 22 25 28 31 34 37 40 43 46 49
Figure 3: A graphical representation of the fast growing Fibonacci sequence
The next task required students to compute ratios of consecutive terms of the sequence. This can be easily achieved in Excel by entering = B3 / B2 in cell C3 followed by a double click. Figure 2 shows the output in column C. Students observed immediately that the ratios “settle down” to 1.618034 after a few iterations. To further kindle their curiosity, they were asked whether this value (that is, 1.618034) would remain the same if the initial values of the Fibonacci sequence (that is, 1 and 1) were changed. They began to investigate by changing values in cells B2 and B3 of the Excel sheet. Figure 4 shows the output for the initial values 4 and 7. The ratios of successive terms approached 1.618034 irrespective of the initial values! This revelation fascinated the students as many had conjectured that the steady ratio value would change if the initial values of the sequence were changed.
37
Ramanujan
YATRA
   A
   B
   C
    Fibonacci Sequence F (n+1)/F(n)
   1
  4
     2
   7
   1.75
   3
 11
 1.5714286
   4
   18
   1.6363636
