
Page 34 - Simplicity is Key in CRT
P. 34
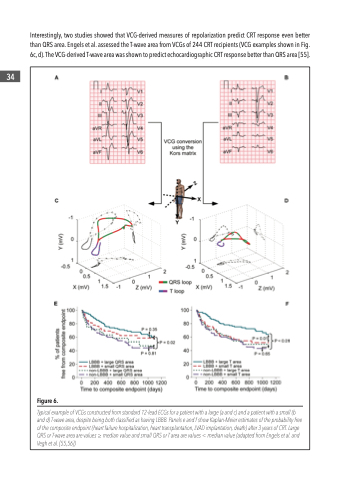
 Figure 6.
Typical example of VCGs constructed from standard 12-lead ECGs for a patient with a large (a and c) and a patient with a small (b and d) T-wave area, despite being both classified as having LBBB. Panels e and f show Kaplan-Meier estimates of the probability free of the composite endpoint (heart failure hospitalization, heart transplantation, LVAD implantation, death) after 3 years of CRT. Large QRS or T-wave area are values ≥ median value and small QRS or T area are values < median value (adapted from Engels et al. and Vegh et al. [55,56])
 34
 Interestingly, two studies showed that VCG-derived measures of repolarization predict CRT response even better than QRS area. Engels et al. assessed the T-wave area from VCGs of 244 CRT recipients (VCG examples shown in Fig. 6c, d). The VCG-derived T-wave area was shown to predict echocardiographic CRT response better than QRS area [55].
