
Page 33 - Simplicity is Key in CRT
P. 33
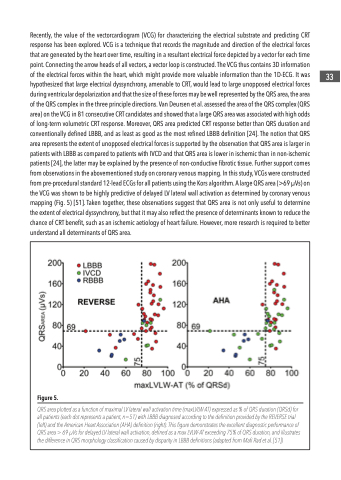
Recently, the value of the vectorcardiogram (VCG) for characterizing the electrical substrate and predicting CRT response has been explored. VCG is a technique that records the magnitude and direction of the electrical forces that are generated by the heart over time, resulting in a resultant electrical force depicted by a vector for each time point. Connecting the arrow heads of all vectors, a vector loop is constructed. The VCG thus contains 3D information of the electrical forces within the heart, which might provide more valuable information than the 1D-ECG. It was hypothesized that large electrical dyssynchrony, amenable to CRT, would lead to large unopposed electrical forces during ventricular depolarization and that the size of these forces may be well represented by the QRS area, the area of the QRS complex in the three principle directions. Van Deursen et al. assessed the area of the QRS complex (QRS area) on the VCG in 81 consecutive CRT candidates and showed that a large QRS area was associated with high odds of long-term volumetric CRT response. Moreover, QRS area predicted CRT response better than QRS duration and conventionally defined LBBB, and as least as good as the most refined LBBB definition [24]. The notion that QRS area represents the extent of unopposed electrical forces is supported by the observation that QRS area is larger in patients with LBBB as compared to patients with IVCD and that QRS area is lower in ischemic than in non-ischemic patients [24], the latter may be explained by the presence of non-conductive fibrotic tissue. Further support comes from observations in the abovementioned study on coronary venous mapping. In this study, VCGs were constructed from pre-procedural standard 12-lead ECGs for all patients using the Kors algorithm. A large QRS area (>69 μVs) on the VCG was shown to be highly predictive of delayed LV lateral wall activation as determined by coronary venous mapping (Fig. 5) [51]. Taken together, these observations suggest that QRS area is not only useful to determine the extent of electrical dyssynchrony, but that it may also reflect the presence of determinants known to reduce the chance of CRT benefit, such as an ischemic aetiology of heart failure. However, more research is required to better understand all determinants of QRS area.
  Figure 5.
QRS area plotted as a function of maximal LV lateral wall activation time (maxLVLW-AT) expressed as % of QRS duration (QRSd) for all patients (each dot represents a patient, n=51) with LBBB diagnosed according to the definition provided by the REVERSE trial (left) and the American Heart Association (AHA) definition (right). This figure demonstrates the excellent diagnostic performance of QRS area > 69 μVs for delayed LV lateral wall activation, defined as a max LVLW-AT exceeding 75% of QRS duration, and illustrates the difference in QRS morphology classification caused by disparity in LBBB definitions (adapted from Mafi Rad et al. [51])
 33
