
Page 81 - Simplicity is Key in CRT
P. 81
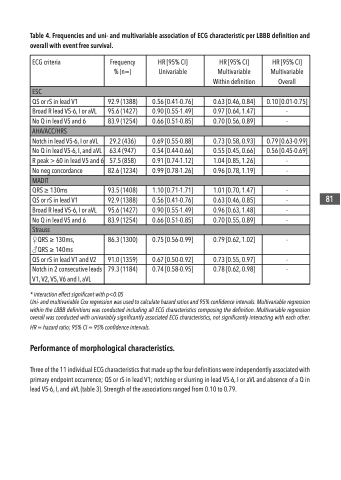
Table 4. Frequencies and uni- and multivariable association of ECG characteristic per LBBB definition and overall with event free survival.
ECG criteria
  Frequency % (n=)
HR [95% CI] Univariable
 HR [95% CI] Multivariable Within definition
 HR [95% CI] Multivariable Overall
ESC
   QS or rS in lead V1
92.9 (1388)
0.56 [0.41-0.76]
0.63 [0.46, 0.84]
0.10 [0.01-0.75]
Broad R lead V5-6, I or aVL
95.6 (1427)
0.90 [0.55-1.49]
0.97 [0.64, 1.47]
-
No Q in lead V5 and 6
83.9 (1254)
0.66 [0.51-0.85]
0.70 [0.56, 0.89]
-
AHA/ACC/HRS
   Notch in lead V5-6, I or aVL
29.2 (436)
0.69 [0.55-0.88]
0.73 [0.58, 0.93]
0.79 [0.63-0.99]
No Q in lead V5-6, I, and aVL
63.4 (947)
0.54 [0.44-0.66]
0.55 [0.45, 0.66]
0.56 [0.45-0.69]
R peak > 60 in lead V5 and 6
57.5 (858)
0.91 [0.74-1.12]
1.04 [0.85, 1.26]
-
No neg concordance
82.6 (1234)
0.99 [0.78-1.26]
0.96 [0.78, 1.19]
-
MADIT
   QRS ≥ 130ms
93.5 (1408)
1.10 [0.71-1.71]
1.01 [0.70, 1.47]
-
QS or rS in lead V1
92.9 (1388)
0.56 [0.41-0.76]
0.63 [0.46, 0.85]
-
Broad R lead V5-6, I or aVL
95.6 (1427)
0.90 [0.55-1.49]
0.96 [0.63, 1.48]
-
No Q in lead V5 and 6
83.9 (1254)
0.66 [0.51-0.85]
0.70 [0.55, 0.89]
-
Strauss
   ♀QRS ≥ 130ms, ♂QRS ≥ 140ms
86.3 (1300)
0.75 [0.56-0.99]
0.79 [0.62, 1.02]
-
QS or rS in lead V1 and V2
91.0 (1359)
0.67 [0.50-0.92]
0.73 [0.55, 0.97]
-
Notch in 2 consecutive leads V1, V2, V5, V6 and I, aVL
79.3 (1184)
0.74 [0.58-0.95]
0.78 [0.62, 0.98]
-
                             * interaction effect significant with p<0.05
Uni- and multivariable Cox regression was used to calculate hazard ratios and 95% confidence intervals. Multivariable regression within the LBBB definitions was conducted including all ECG characteristics composing the definition. Multivariable regression overall was conducted with univariably significantly associated ECG characteristics, not significantly interacting with each other.
HR = hazard ratio; 95% CI = 95% confidence intervals.
Performance of morphological characteristics.
Three of the 11 individual ECG characteristics that made up the four definitions were independently associated with primary endpoint occurrence; QS or rS in lead V1; notching or slurring in lead V5-6, I or aVL and absence of a Q in lead V5-6, I, and aVL (table 3). Strength of the associations ranged from 0.10 to 0.79.
81
