
Page 95 - Simplicity is Key in CRT
P. 95
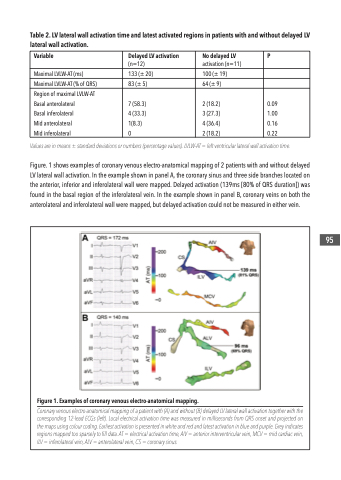
Table 2. LV lateral wall activation time and latest activated regions in patients with and without delayed LV lateral wall activation.
   Variable
Delayed LV activation
(n=12)
No delayed LV
activation (n=11)
P
Maximal LVLW-AT (ms)
133 (± 20)
100 (± 19)
Maximal LVLW-AT (% of QRS)
83 (± 5)
64 (± 9)
Region of maximal LVLW-AT Basal anterolateral
Basal inferolateral
Mid anterolateral
Mid inferolateral
7 (58.3) 4 (33.3) 1(8.3) 0
2 (18.2) 3 (27.3) 4 (36.4) 2 (18.2)
0.09 1.00 0.16 0.22
    Values are in means ± standard deviations or numbers (percentage values). LVLW-AT = left ventricular lateral wall activation time.
Figure. 1 shows examples of coronary venous electro-anatomical mapping of 2 patients with and without delayed LV lateral wall activation. In the example shown in panel A, the coronary sinus and three side branches located on the anterior, inferior and inferolateral wall were mapped. Delayed activation (139ms [80% of QRS duration]) was found in the basal region of the inferolateral vein. In the example shown in panel B, coronary veins on both the anterolateral and inferolateral wall were mapped, but delayed activation could not be measured in either vein.
  Figure 1. Examples of coronary venous electro-anatomical mapping.
Coronary venous electro-anatomical mapping of a patient with (A) and without (B) delayed LV lateral wall activation together with the corresponding 12-lead ECGs (left). Local electrical activation time was measured in milliseconds from QRS onset and projected on the maps using colour coding. Earliest activation is presented in white and red and latest activation in blue and purple. Grey indicates regions mapped too sparsely to fill data. AT = electrical activation time, AIV = anterior interventricular vein, MCV = mid cardiac vein, ILV = inferolateral vein, ALV = anterolateral vein, CS = coronary sinus.
  95
