
Page 102 - Airplane Flying Handbook
P. 102
As illustrated in the airplane's power required and available curves [Figure 4-14], the airplane slows down, going from speed 1 where
to
,
2
it is climbing (A: power available greater than power required), speed where it stops climbing (B: power available equal to
power required), and continuing to speed 3 where the stall horn sounds (C: power available less than power required). The
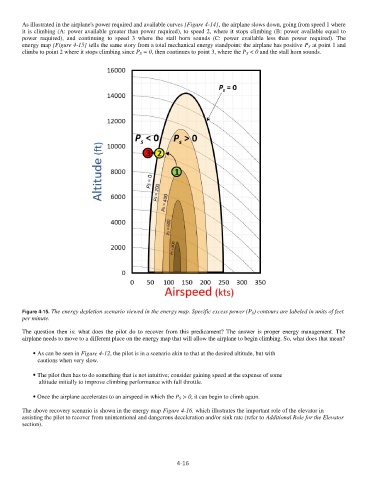
energy map [Figure 4-15] tells the same story from a total mechanical energy standpoint: the airplane has positive P S at point 1 and
climbs to point 2 where it stops climbing since P S = 0, then continues to point 3, where the P S < 0 and the stall horn sounds.
Figure 4-15. The energy depletion scenario viewed in the energy map. Specific excess power (P S ) contours are labeled in units of feet
per minute.
The question then is: what does the pilot do to recover from this predicament? The answer is proper energy management. The
move to a different place on the energy map that will allow the airplane to begin climbing. So, what does that mean?
airplane needs to
⦁ As can be seen in Figure 4-12, the pilot is in a scenario akin to that at the desired altitude, but with
cautions when very slow.
⦁ The pilot then has to do something that is not intuitive; consider gaining speed at the expense of some
altitude initially to improve climbing performance with full throttle.
⦁ Once the airplane accelerates to an airspeed in which the P S > 0, it can begin to climb again.
The above recovery scenario is shown in the energy map Figure 4-16, which illustrates the important role of the elevator in
assisting the pilot to recover from unintentional and dangerous deceleration and/or sink rate (refer to Additional Role for the Elevator
section).
4-16