
Page 141 - Servo Motors and Industrial Control Theory
P. 141
136 8 Actuators Based on Electro-Rheological Fluid
Fig. 8.9 Estimated values V = 600 Q = 3
of R at various excitation + V = 600 Q = 9
frequency # V = 600 Q = 15
120 + + + V = 1200 Q = 3
R + * * + * + * V = 1200 Q = 9
(Kn) * * + * V = 1200 Q = 15
80
+
*
++ + + + + +
40 +
0
0 40 80 120 160 200
FREQUENY (HZ)
Fig. 8.10 Estimated values 120 V = 600 Q = 3
of C at various excitation + V = 600 Q = 9
frequency C + # V = 600 Q = 15
(nF) + V = 1200 Q = 3
80 o V = 1200 Q = 9
+ * o * V = 1200 Q = 15
40
* + *
* +
* + * * + * + + * + *
*
0
0 40 80 120 160 200
FREQUENY (HZ)
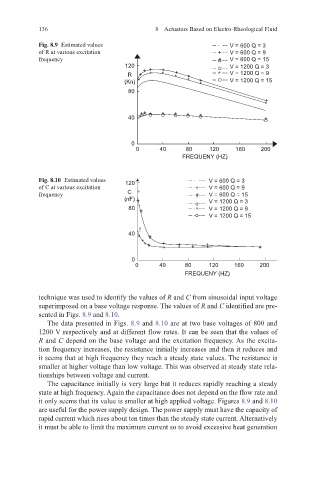
technique was used to identify the values of R and C from sinusoidal input voltage
superimposed on a base voltage response. The values of R and C identified are pre-
sented in Figs. 8.9 and 8.10.
The data presented in Figs. 8.9 and 8.10 are at two base voltages of 800 and
1200 V respectively and at different flow rates. It can be seen that the values of
R and C depend on the base voltage and the excitation frequency. As the excita-
tion frequency increases, the resistance initially increases and then it reduces and
it seems that at high frequency they reach a steady state values. The resistance is
smaller at higher voltage than low voltage. This was observed at steady state rela-
tionships between voltage and current.
The capacitance initially is very large but it reduces rapidly reaching a steady
state at high frequency. Again the capacitance does not depend on the flow rate and
it only seems that its value is smaller at high applied voltage. Figures 8.9 and 8.10
are useful for the power supply design. The power supply must have the capacity of
rapid current which rises about ten times than the steady state current. Alternatively
it must be able to limit the maximum current so to avoid excessive heat generation