
Page 65 - MASHRAE 35th Anniversary
P. 65
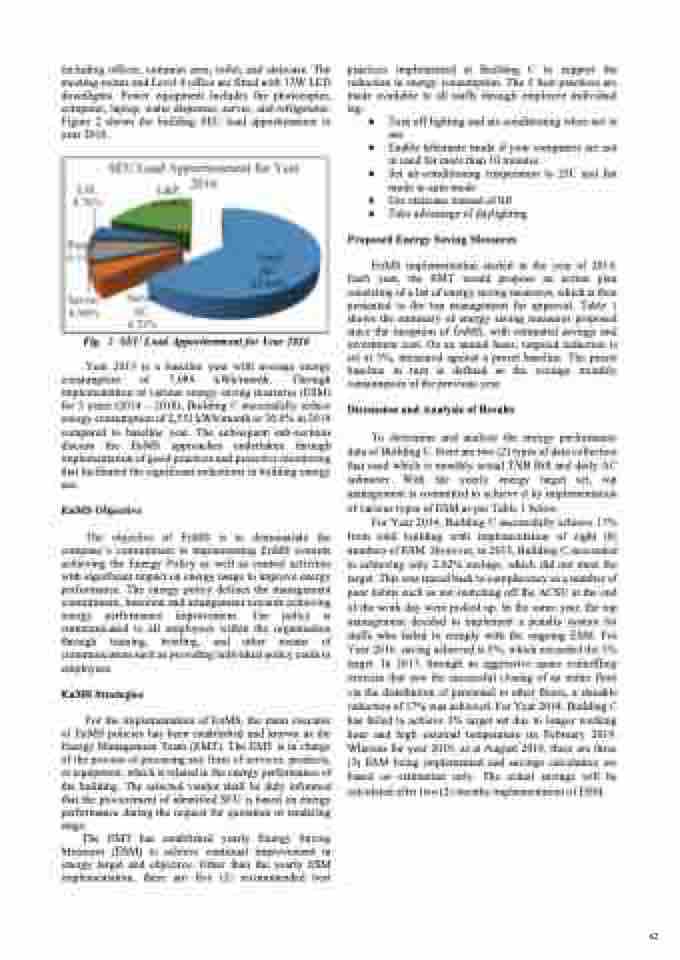
including offices, common area, toilet, and staircase. The meeting rooms and Level 4 office are fitted with 13W LED downlights. Power equipment includes the photocopier, computer, laptop, water dispenser, server, and refrigerator. Figure 2 shows the building SEU load apportionment in year 2016.
Fig. 2 SEU Load Apportionment for Year 2016
Year 2013 is a baseline year with average energy consumption of 7,089 kWh/month. Through implementation of various energy saving measures (ESM) for 5 years (2014 2018), Building C successfully reduce energy consumption of 2,551 kWh/month or 36.0% in 2018 compared to baseline year. The subsequent sub-sections discuss the EnMS approaches undertaken through implementation of good practices and proactive monitoring that facilitated the significant reductions in building energy use.
EnMS Objective
The objective of EnMS is to demonstrate the compan commimen in implemening EnMS oard achieving the Energy Policy as well as control activities with significant impact on energy usage to improve energy performance. The energy policy defines the management commitment, intention and arrangement towards achieving energy performance improvement. The policy is communicated to all employees within the organization through training, briefing, and other means of communication such as providing individual policy cards to employees.
EnMS Strategies
For the implementation of EnMS, the main executor of EnMS policies has been established and known as the Energy Management Team (EMT). The EMT is in charge of the process of procuring any form of services, products, or equipment, which is related to the energy performance of the building. The selected vendor shall be duly informed that the procurement of identified SEU is based on energy performance during the request for quotation or tendering stage.
The EMT has established yearly Energy Saving Measures (ESM) to achieve continual improvement in energy target and objective. Other than the yearly ESM implementation, there are five (5) recommended best
practices implemented at Building C to support the reduction in energy consumption. The 5 best practices are made available to all staffs through employee individual tag:
Turn off lighting and air-conditioning when not in use
Enable hibernate mode if your computers are not in used for more than 10 minutes
Set air-conditioning temperature to 25C and fan mode to auto mode
Use staircase instead of lift
Take advantage of daylighting
Proposed Energy Saving Measures
EnMS implementation started in the year of 2014. Each year, the EMT would propose an action plan consisting of a list of energy saving measures, which is then presented to the top management for approval. Table 1 shows the summary of energy saving measures proposed since the inception of EnMS, with estimated savings and investment cost. On an annual basis, targeted reduction is set at 3%, measured against a preset baseline. The preset baseline in turn is defined as the average monthly consumption of the previous year.
Discussion and Analysis of Results
To determine and analyze the energy performance data of Building C, there are two (2) types of data collection that used which is monthly actual TNB Bill and daily AC submeter. With the yearly energy target set, top management is committed to achieve it by implementation of various types of ESM as per Table 1 below.
For Year 2014, Building C successfully achieve 17% from total building with implementation of eight (8) numbers of ESM. However, in 2015, Building C succeeded in achieving only 2.62% savings, which did not meet the target. This was traced back to complacency as a number of poor habits such as not switching off the ACSU at the end of the work day were picked up. In the same year, the top management decided to implement a penalty system for staffs who failed to comply with the ongoing ESM. For Year 2016, saving achieved is 5%, which exceeded the 3% target. In 2017, through an aggressive space reshuffling exercise that saw the successful closing of an entire floor via the distribution of personnel to other floors, a sizeable reduction of 17% was achieved. For Year 2018, Building C has failed to achieve 3% target set due to longer working hour and high external temperature on February 2019. Whereas for year 2019, as at August 2019, there are three (3) ESM being implemented and savings calculation are based on estimation only. The actual savings will be calculated after two (2) months implementation of ESM.
2
