
Page 67 - MASHRAE 35th Anniversary
P. 67
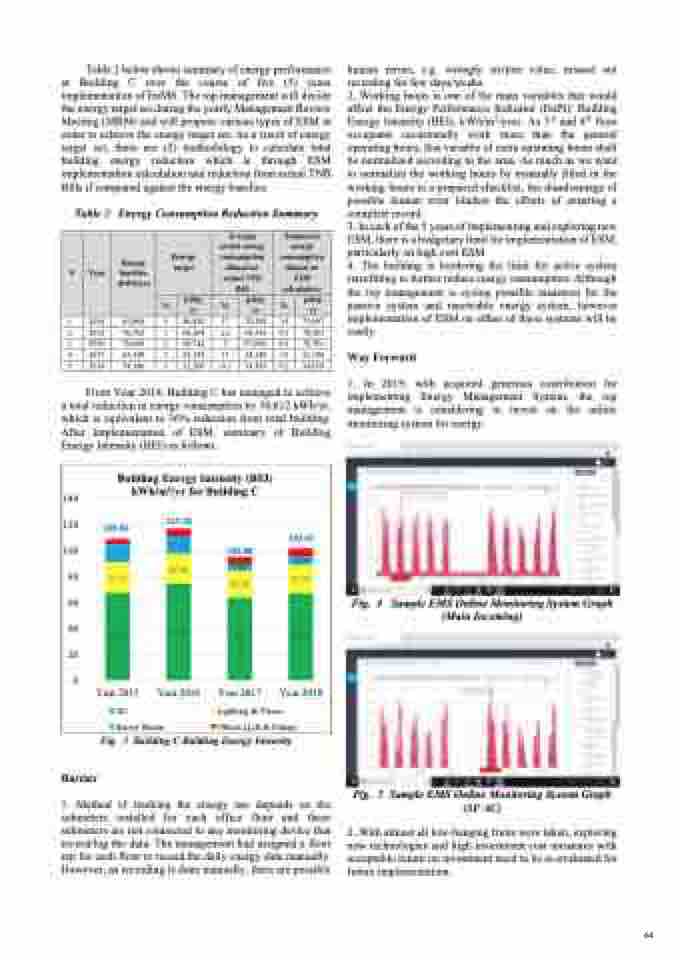
Table 2 below shows summary of energy performance at Building C over the course of five (5) years implementation of EnMS. The top management will decide the energy target set during the yearly Management Review Meeting (MRM) and will propose various types of ESM in order to achieve the energy target set. As a result of energy target set, there are (2) methodology to calculate total building energy reduction which is through ESM implementation calculation and reduction from actual TNB Bills if compared against the energy baseline.
human errors, e.g. wrongly written value, missed out recording for few days/weeks.
2. Working hours is one of the main variables that would affect the Energy Performance Indicator (EnPI): Building Energy Intensity (BEI), kWh/m2/year. As 3rd and 4th floor occupants occasionally work more than the general operating hours, this variable of extra operating hours shall be normalized according to the area. As much as we want to normalize the working hours by manually filled in the working hours in a prepared checklist, the disadvantage of possible human error hinders the efforts of ensuring a complete record.
3. In each of the 5 years of implementing and exploring new ESM, there is a budgetary limit for implementation of ESM, particularly on high cost ESM.
4. The building is bordering the limit for active system retrofitting to further reduce energy consumption. Although the top management is eyeing possible measures for the passive system and renewable energy system, however implementation of ESM on either of these systems will be costly.
Way Forward
1. In 2019, with acquired generous contribution for implementing Energy Management System, the top management is considering to invest on the online monitoring system for energy.
Table 2
1 2014
2 2015
3 2016
4 2017
5 2018
Energy Consumption Reduction Summary
                   #
Year
Energy baseline (kWh/yr)
85,068 5 70,392 3 70,848 3 65,148 3 54,180 3
80,820 17 68,304 2.6 68,724 5 63,192 17 52,560 -0.5
70,392 14 68,556 0.1 67,056 0.1 54,180 15 54,456 0.2
73,097 70,303 70,761 55,106 54,059
Energy target
kWh/
% %yr %
Average
actual energy consumption (Based on actual TNB Bill)
Estimated
energy consumption (Based on ESM calculation)
    kWh/ yr
kWh/ yr
                  From Year 2014, Building C has managed to achieve a total reduction in energy consumption by 30,612 kWh/yr, which is equivalent to 36% reduction from total building. After implementation of ESM, summary of Building Energy Intensity (BEI) as follows:
   140 120
100
 80
 60
 40
 20
  0
Building Energy Intensity (BEI) kWh/m2/yr for Building C
 109.84
3.96
127.35
  13.79
23.32
67.43
13.56
22.84
74.46
5.52
4.90
20.58
63.97
6.33
6.20
21.76
67.15
 Year 2016 Server Room
Year 2017
Year 2018
Year 2015
AC
Lighting & Power Others (Lift & Pump)
5.67
102.89
103.42
  Fig. 4
Sample EMS Online Monitoring System Graph (Main Incoming)
    Fig. 3 Building C Building Energy Intensity
Barrier
1. Method of tracking the energy use depends on the submeters installed for each office floor and these submeters are not connected to any monitoring device that record/log the data. The management had assigned a floor rep for each floor to record the daily energy data manually. However, as recording is done manually, there are possible
Fig. 5 Sample EMS Online Monitoring System Graph (3F AC)
2. With almost all low-hanging fruits were taken, exploring new technologies and high investment cost measures with acceptable return on investment need to be re-evaluated for future implementation.
4
