
Page 8 - PARC_Annual_Report
P. 8
PASSYUNK A V E N U E A CHANGING PICTURE
CORPORATION
REVITALIZATION
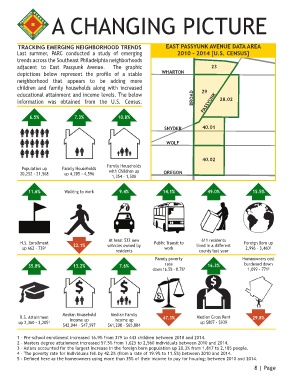
TRACKING EMERGING NEIGHBORHOOD TRENDS EAST PASSYUNK AVENUE DATA AREA
2010 - 2014 [U.S. CENSUS]
Last summer, PARC conducted a study of emerging WASHINGTON
trends across the Southeast Philadelphia neighborhoods
adjacent to East Passyunk Avenue. The graphic 23
depictions below represent the profile of a stable WHARTON
neighborhood that appears to be adding more
children and family households along with increased
educational attainment and income levels. The below 29
information was obtained from the U.S. Census. BROAD PASSYUNK 28.02
6.5% 7.3% 10.8%
SNYDER 40.01
WOLF
40.02
Family Households
Population up Family Households with Children up
20,252 - 21,568 up 4,285 - 4,596 OREGON
1,354 - 1,500
11.6% Walking to work 9.4% 14.1% 49.0% 15.5%
At least 532 new 611 residents
H.S. Enrollment 22.1% vehicles owned by Public Transit to lived in a different Foreign Born up
up 662 - 739¹ work 2,996 - 3,460³
residents county last year
Family poverty Homeowners cost
35.8% 13.2% 7.6% rate 16.3% burdened down
down 16.5% - 8.7%⁴ 1,099 - 771⁵
Median Household Median Family
B.S. Attainment Income up Income up 47.3% Median Gross Rent 29.8%
up 2,360 - 3,205² up $807 - $939
$42,044 - $47,597 $61,208 - $65,884
1 - Pre-school enrollment increased 16.9% from 379 to 443 children between 2010 and 2014.
2 - Masters degree attainment increased 57.5% from 1,625 to 2,560 individuals between 2010 and 2014.
3 - Asians accounted for the largest increase in the foreign born population up 20.3% from 1,817 to 2,185 people.
4 - The poverty rate for individuals fell by 42.2% (from a rate of 19.9% to 11.5%) between 2010 and 2014.
5 - Defined here as the homeowners using more than 35% of their income to pay for housing; between 2010 and 2014.
8 | Page