
Page 364 - Ranah Studi Agraria: Penguasaan Tanah dan Hubungan Agraris
P. 364
Landownership Tenancy, and ...
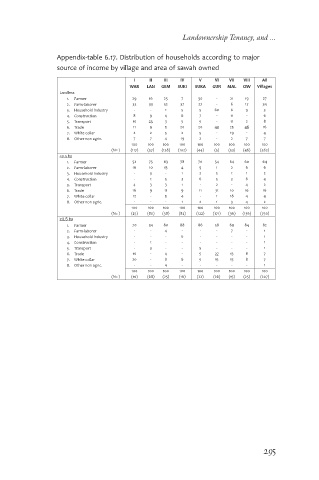
Appendix-table 6.17. Distribution of households according to major
source of income by village and area of sawah owned
I II III IV V VI VII VIII All
WAR LAN GEM SUKI SUKA GUN MAL CIW Villages
Landless
1. Farmer 29 16 25 7 30 - 21 19 27
2. Farm-laborer 33 33 52 37 27 - 6 17 34
3. Household industry - - 1 5 5 60 6 9 3
4. Construction 8 9 4 6 7 - 11 - 6
5. Transport 10 25 3 5 5 - 11 2 8
6. Trade 11 9 5 20 20 40 25 46 16
7. White collar 2 2 5 2 5 - 19 - 4
8. Other non agric. 7 7 4 19 2 - 2 7 7
100 100 100 100 100 100 100 100 100
(N= ) (117) (57) (138) (102) (44) (5) (53) (46) (562)
<0.5 ha
1. Farmer 52 75 63 78 70 54 64 60 64
2. Farm-laborer 16 10 13 4 9 1 2 6 6
3. Household industry - 3 - 1 2 5 1 1 2
4. Construction - 1 5 2 6 5 2 6 4
5. Transport 4 3 3 1 - 2 - 4 2
6. Trade 16 9 11 9 11 31 10 16 16
7. White collar 12 - 5 4 - 1 18 4 4
8. Other non agric. - - - 1 2 1 3 4 2
100 100 100 100 100 100 100 100 100
(N= ) (25) (80) (38) (82) (122) (171) (96) (136) (750)
≥0.5 ha
1. Farmer 70 94 80 88 86 58 69 84 82
2. Farm-laborer - - 4 - - - 7 - 1
3. Household industry - - - 6 - - - - 1
4. Construction - 1 - - - - - - 1
5. Transport - 3 - - 5 - - - 1
6. Trade 10 - 4 - 5 27 13 8 7
7. White collar 20 - 8 6 5 15 13 8 7
8. Other non agric. - - 4 - - - - - 1
100 100 100 100 100 100 100 100 100
(N= ) (10) (68) (25) (16) (22) (26) (15) (25) (207)
295