Page 522 - Microeconomics, Fourth Edition
P. 522

c12capturingsurplus.qxd  7/22/10  10:41 AM  Page 496


                  496                   CHAPTER 12   CAPTURING SURPLUS
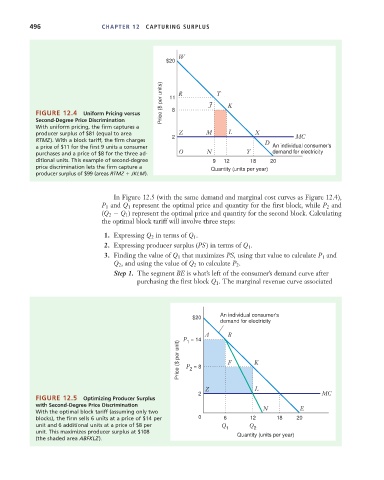


                                                           $20  W


                                                          Price ($ per units)  11  R  J  T  K


                    FIGURE 12.4   Uniform Pricing versus     8
                    Second-Degree Price Discrimination
                    With uniform pricing, the firm captures a
                    producer surplus of $81 (equal to area   2  Z      M      L       X
                    RTMZ). With a block tariff, the firm charges                                  MC
                    a price of $11 for the first 9 units a consumer                      D  An individual consumer's
                    purchases and a price of $8 for the three ad-  O   N           Y       demand for electricity
                    ditional units. This example of second-degree        9  12      18    20
                    price discrimination lets the firm capture a        Quantity (units per year)
                    producer surplus of $99 (areas RTMZ   JKLM).


                                           In Figure 12.5 (with the same demand and marginal cost curves as Figure 12.4),
                                        P and Q represent the optimal price and quantity for the first block, while P and
                                         1
                                                1
                                                                                                           2
                                        (Q   Q ) represent the optimal price and quantity for the second block. Calculating
                                          2
                                               1
                                        the optimal block tariff will involve three steps:
                                        1. Expressing Q in terms of Q .
                                                       2
                                                                   1
                                        2. Expressing producer surplus (PS) in terms of Q .
                                                                                    1
                                        3. Finding the value of Q that maximizes PS, using that value to calculate P and
                                                                                                          1
                                                               1
                                           Q , and using the value of Q to calculate P .
                                                                   2
                                                                                2
                                             2
                                           Step 1. The segment BE is what’s left of the consumer’s demand curve after
                                                  purchasing the first block Q . The marginal revenue curve associated
                                                                          1
                                                                           An individual consumer's
                                                                   $20
                                                                           demand for electricity
                                                                       A      B
                                                                P  = 14
                                                                 1
                                                               Price ($ per unit)  P  = 8  F  K
                                                                  2


                                                                                      L
                                                                       Z
                                                                     2                                    MC
                    FIGURE 12.5   Optimizing Producer Surplus
                    with Second-Degree Price Discrimination
                    With the optimal block tariff (assuming only two                    N          E
                    blocks), the firm sells 6 units at a price of $14 per  0  6     12      18    20
                    unit and 6 additional units at a price of $8 per
                                                                            Q 1     Q 2
                    unit. This maximizes producer surplus at $108               Quantity (units per year)
                    (the shaded area ABFKLZ).
   517   518   519   520   521   522   523   524   525   526   527