
Page 97 - Business Principles and Management
P. 97
Unit 1
FIGURE 4-2 Countries of the Pacific Rim and European Union
Pacific Rim European Union
SOUTH KOREA AUSTRIA ITALY
TAIWAN BELGIUM LATVIA
CHINA CYPRUS LITHUANIA
HONG KONG CZECH REPUBLIC LUXEMBOURG
SINGAPORE DENMARK MALTA
ESTONIA THE NETHERLANDS
FINLAND POLAND
FRANCE PORTUGAL
GERMANY SLOVAKIA
GREECE SLOVENIA
HUNGARY SWEDEN
IRELAND UNITED KINGDOM
TRADE, INVESTMENT, AND THE ECONOMY
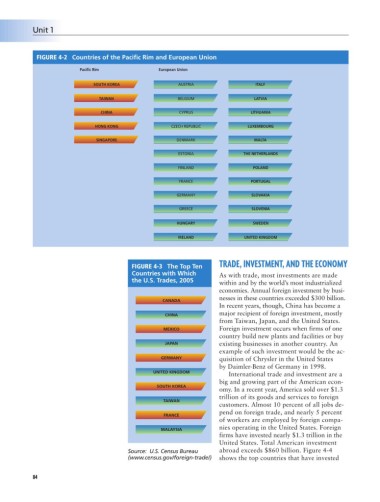
FIGURE 4-3 The Top Ten
Countries with Which As with trade, most investments are made
the U.S. Trades, 2005
within and by the world’s most industrialized
economies. Annual foreign investment by busi-
nesses in these countries exceeded $300 billion.
CANADA
In recent years, though, China has become a
major recipient of foreign investment, mostly
CHINA
from Taiwan, Japan, and the United States.
MEXICO Foreign investment occurs when firms of one
country build new plants and facilities or buy
JAPAN existing businesses in another country. An
example of such investment would be the ac-
GERMANY quisition of Chrysler in the United States
by Daimler-Benz of Germany in 1998.
UNITED KINGDOM
International trade and investment are a
big and growing part of the American econ-
SOUTH KOREA
omy. In a recent year, America sold over $1.3
trillion of its goods and services to foreign
TAIWAN
customers. Almost 10 percent of all jobs de-
pend on foreign trade, and nearly 5 percent
FRANCE
of workers are employed by foreign compa-
nies operating in the United States. Foreign
MALAYSIA
firms have invested nearly $1.3 trillion in the
United States. Total American investment
Source: U.S. Census Bureau abroad exceeds $860 billion. Figure 4-4
(www.census.gov/foreign-trade/) shows the top countries that have invested
84