
Page 179 - Environment: The Science Behind the Stories
P. 179
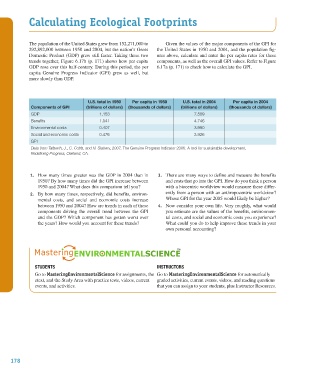
Calculating Ecological Footprints


                     The population of the United States grew from 152,271,000 to   Given the values of the major components of the GPI for
                     292,892,000 between 1950 and 2004, but the nation’s Gross   the United States in 1950 and 2004, and the population fig-
                     Domestic Product (GDP) grew still faster. Taking these two   ures above, calculate and enter the per capita rates for these
                     trends together, Figure 6.17b (p. 171) shows how per capita   components, as well as the overall GPI values. Refer to Figure
                     GDP rose over this half-century. During this period, the per   6.17a (p. 171) to check how to calculate the GPI.
                     capita Genuine Progress Indicator (GPI) grew as well, but
                     more slowly than GDP.


                                             U.S. total in 1950   Per capita in 1950   U.S. total in 2004    Per capita in 2004
                      Components of GPI     (trillions of dollars)  (thousands of dollars)  (trillions of dollars)  (thousands of dollars)
                      GDP                         1.153                                  7.589
                      Benefits                    1.041                                  4.746
                      Environmental costs         0.407                                  3.990
                      Social and economic costs   0.476                                  3.926
                      GPI
                      Data from Talberth, J., C. Cobb, and N. Slattery, 2007. The Genuine Progress Indicator 2006: A tool for sustainable development.
                      Redefining Progress, Oakland, CA.


                      1.  How many times greater was the GDP in 2004 than in    3.  There are many ways to define and measure the benefits
                        1950? By how many times did the GPI increase between   and costs that go into the GPI. How do you think a person
                        1950 and 2004? What does this comparison tell you?   with a biocentric worldview would measure these differ-
                      2.  By how many times, respectively, did benefits, environ-  ently from a person with an anthropocentric worldview?
                        mental costs, and social and economic costs increase   Whose GPI for the year 2005 would likely be higher?
                        between 1950 and 2004? How are trends in each of these    4.  Now consider your own life. Very roughly, what would
                        components driving the overall trend between the GPI   you estimate are the values of the benefits, environmen-
                        and the GDP? Which component has gotten worst over   tal costs, and social and economic costs you experience?
                        the years? How would you account for these trends?   What could you do to help improve these trends in your
                                                                             own personal accounting?


                       STUDENTS                                           INSTRUCTORS
                       Go to MasteringEnvironmentalScience for assignments, the  Go to MasteringEnvironmentalScience for automatically
                       etext, and the Study Area with practice tests, videos, current   graded activities, current events, videos, and reading questions
                       events, and activities.                            that you can assign to your students, plus Instructor Resources.


             178


           M06_WITH7428_05_SE_C06.indd   178                                                                                    12/12/14   2:57 PM