
Page 324 - Environment: The Science Behind the Stories
P. 324
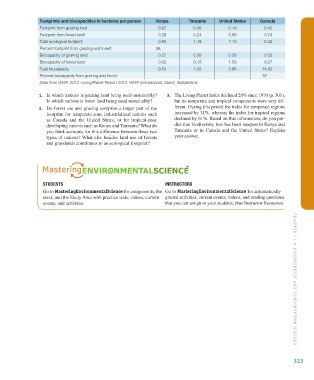
Footprints and biocapacities in hectares per person  Kenya    Tanzania    United States    Canada
                         Footprint from grazing land                      0.27           0.36          0.19           0.42
                         Footprint from forest land                       0.28           0.24          0.86           0.74
                         Total ecological footprint                       0.95           1.19          7.19           6.43
                         Percent footprint from grazing and forest       58
                         Biocapacity of grazing land                      0.27           0.39          0.26           0.23
                         Biocapacity of forest land                       0.02           0.13          1.56           8.27
                         Total biocapacity                                0.53           1.02          3.86          14.92
                         Percent biocapacity from grazing and forest                                                 57
                         Data from WWF, 2012. Living Planet Report 2012. WWF International, Gland, Switzerland.

                         1.  In which nations is grazing land being used sustainably?    3.  The Living Planet Index declined 28% since 1970 (p. 301),
                            In which nations is forest land being used sustainably?  but its temperate and tropical components were very dif-
                         2.  Do forest use and grazing comprise a larger part of the   ferent. During this period the index for temperate regions
                            footprint for temperate-zone industrialized nations such   increased by 31%, whereas the index for tropical regions
                            as Canada and the United States, or for tropical-zone   declined by 61%. Based on this information, do you pre-
                            developing nations such as Kenya and Tanzania? What do   dict that biodiversity loss has been steepest in Kenya and
                            you think accounts for this difference between these two   Tanzania or in Canada and the United States? Explain
                            types of nations? What else besides land use of forests   your answer.
                            and grasslands contributes to an ecological footprint?


                           STUDENTS                                          INSTRUCTORS
                           Go to MasteringEnvironmentalScience for assignments, the  Go to MasteringEnvironmentalScience for automatically
                           etext, and the Study Area with practice tests, videos, current  graded activities, current events, videos, and reading questions
                           events, and activities.                           that you can assign to your students, plus Instructor Resources.  CHAPTER 11 • Bi odiv ER si T y  A nd Cons ER vAT i on Bi ology


                                                                                                                                  323


           M11_WITH7428_05_SE_C11.indd   323                                                                                    12/12/14   3:01 PM