
Page 322 - Basic College Mathematics with Early Integers
P. 322
S E C T I O N 4.2 I ADDING AND SUBTRACTING DECIMALS 299
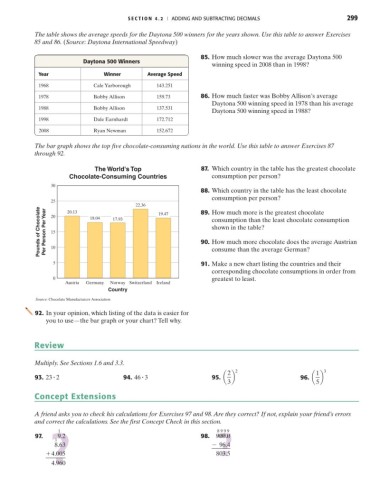
The table shows the average speeds for the Daytona 500 winners for the years shown. Use this table to answer Exercises
85 and 86. (Source: Daytona International Speedway)
85. How much slower was the average Daytona 500
Daytona 500 Winners
winning speed in 2008 than in 1998?
Year Winner Average Speed
1968 Cale Yarborough 143.251
1978 Bobby Allison 159.73 86. How much faster was Bobby Allison’s average
Daytona 500 winning speed in 1978 than his average
1988 Bobby Allison 137.531
Daytona 500 winning speed in 1988?
1998 Dale Earnhardt 172.712
2008 Ryan Newman 152.672
The bar graph shows the top five chocolate-consuming nations in the world. Use this table to answer Exercises 87
through 92.
The World's Top 87. Which country in the table has the greatest chocolate
Chocolate-Consuming Countries consumption per person?
30
88. Which country in the table has the least chocolate
consumption per person?
25
22.36 19.47 89. How much more is the greatest chocolate
Pounds of Chocolate Per Person Per Year 15 17.93 90. How much more chocolate does the average Austrian
20.13
20
18.04
consumption than the least chocolate consumption
shown in the table?
10
consume than the average German?
5 91. Make a new chart listing the countries and their
corresponding chocolate consumptions in order from
0 greatest to least.
Austria Germany Norway Switzerland Ireland
Country
Source: Chocolate Manufacturers Association
92. In your opinion, which listing of the data is easier for
you to use—the bar graph or your chart? Tell why.
Review
Multiply. See Sections 1.6 and 3.3.
2 2 1 3
#
#
93. 23 2 94. 46 3 95. a b 96. a b
3 5
Concept Extensions
A friend asks you to check his calculations for Exercises 97 and 98.Are they correct? If not, explain your friend’s errors
and correct the calculations. See the first Concept Check in this section.
1 8 9 9 9
97. 9.2 98. 900.0
1
8.63 - 96.4
+ 4.005 803.5
4.960