
Page 749 - Basic College Mathematics with Early Integers
P. 749
A PPEND I X C I INDUCTIVE AND DEDUCTIVE REASONING 725
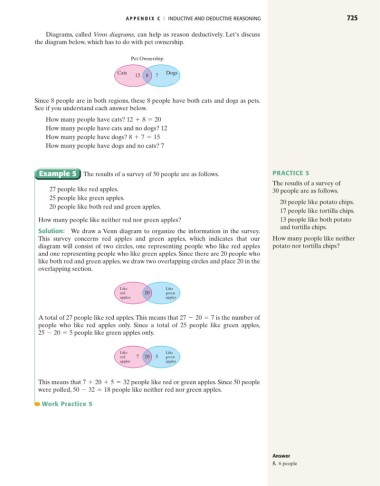
Diagrams, called Venn diagrams, can help us reason deductively. Let’s discuss
the diagram below, which has to do with pet ownership.
Pet Ownership
Cats Dogs
12 8 7
Since 8 people are in both regions, these 8 people have both cats and dogs as pets.
See if you understand each answer below.
How many people have cats? 12 + 8 = 20
How many people have cats and no dogs? 12
How many people have dogs? 8 + 7 = 15
How many people have dogs and no cats? 7
Example 5 The results of a survey of 50 people are as follows. PRACTICE 5
The results of a survey of
27 people like red apples. 30 people are as follows.
25 people like green apples.
20 people like potato chips.
20 people like both red and green apples.
17 people like tortilla chips.
How many people like neither red nor green apples? 13 people like both potato
and tortilla chips.
Solution: We draw a Venn diagram to organize the information in the survey.
This survey concerns red apples and green apples, which indicates that our How many people like neither
diagram will consist of two circles, one representing people who like red apples potato nor tortilla chips?
and one representing people who like green apples. Since there are 20 people who
like both red and green apples, we draw two overlapping circles and place 20 in the
overlapping section.
Like Like
red 20 green
apples apples
A total of 27 people like red apples.This means that 27 - 20 = 7 is the number of
people who like red apples only. Since a total of 25 people like green apples,
25 - 20 = 5 people like green apples only.
Like Like
red 7 20 5 green
apples apples
This means that 7 + 20 + 5 = 32 people like red or green apples. Since 50 people
were polled, 50 - 32 = 18 people like neither red nor green apples.
Work Practice 5
Answer
5. 6 people