Page 782 - Basic College Mathematics with Early Integers
P. 782

A14                            ANSWERS TO SELECTED EXERCISES


           1    1    1     2    1          2    1     2    4     19     1     5    1    20   2     1     1
        11.  13.  15.   17.  19.   21. 1  23.  25.  27.  29.  31.   33.    35.  37.  39.  or 6  41.   43.
           6    3    2     3    3          3    7     7    7    100    20     6    6     3   3     52    13
           1    1     5
        45.  47.  49.    51. 0  53. answers may vary
           4    2    36
      Answers to Selected Exercises
        Chapter 7 Vocabulary Check 1. bar 2. mean  3. outcomes 4. pictograph 5. mode 6. line 7. median 8. tree diagram  9. experiment
        10. circle 11. probability 12. histogram; class interval; class frequency
        Chapter 7 Review  1. 1,500,000  2. 2,000,000  3. South 4. Midwest 5. South 6. Northeast, Midwest,West 7. 11%  8. 2008
        9. 1990, 2000, 2008 10. answers may vary 11. 960  12. 920 13. 930  14. 815  15. 25  16. 145  17. 1 employee  18. 4 employees
        19. 18 employees  20. 9 employees  21. ||||; 5  22. |||; 3  23. ||||; 4  24.  25. mortgage payment  26. utilities
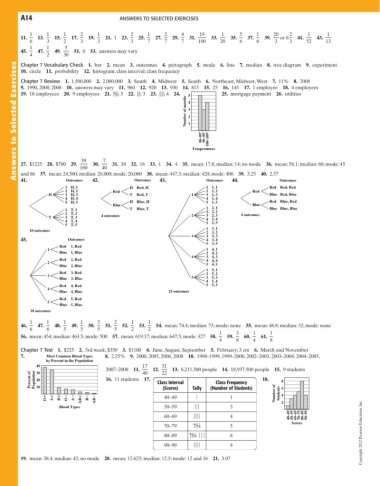
                                                            Number of months 5 4 3 2 1


                                                                 80–89  90–99  100–109


                                                              Temperatures
                           39     7
        27. $1225  28. $700  29.  30.  31. 38  32. 18  33. 1  34. 4  35. mean: 17.8; median: 14; no mode  36. mean: 58.1; median: 60; mode: 45
                           160   40
        and 86 37. mean: 24,500; median: 20,000; mode: 20,000 38. mean: 447.3; median: 420; mode: 400  39. 3.25  40. 2.57
        41.           Outcomes  42.         Outcomes  43.          Outcomes  44.          Outcomes
                      1  H, 1             H  Red, H                1  1, 1             Red  Red, Red
                      2  H, 2        Red                           2  1, 2        Red
                 H    3  H, 3             T  Red, T           1    3  1, 3             Blue  Red, Blue
                      4  H, 4                                      4  1, 4
                      5  H, 5             H  Blue, H               5  1, 5             Red  Blue, Red
                                     Blue                                         Blue
                      1  T, 1             T  Blue, T               1 2  2, 1           Blue  Blue, Blue
                                                                     2, 2
                      2  T, 2                                                 4 outcomes
                 T    3  T, 3    4 outcomes                   2    3 4  2, 3
                                                                     2, 4
                      4  T, 4                                      5  2, 5
                      5  T, 5
                                                                   1  3, 1
          10 outcomes
                                                                   2  3, 2
                                                              3    3  3, 3
        45.            Outcomes                                    4  3, 4
                                                                   5  3, 5
                    Red  1, Red
                1                                                  1  4, 1
                    Blue  1, Blue                                  2  4, 2
                                                              4    3  4, 3
                    Red  2, Red                                    4  4, 4
                2
                    Blue  2, Blue                                  5  4, 5
                                                                   1  5, 1
                    Red  3, Red                                    2  5, 2
                3
                    Blue  3, Blue                             5    3  5, 3
                                                                   4  5, 4
                    Red  4, Red                                    5  5, 5
                4
                    Blue  4, Blue                      25 outcomes
                    Red  5, Red
                5
                    Blue  5, Blue
           10 outcomes
           1    1    1     1    3    2     1    1
        46.  47.  48.   49.  50.   51.  52.  53.   54. mean: 74.4; median: 73; mode: none  55. mean: 48.8; median: 32; mode: none
           6    6    5     5    5    5     2    2
                                                                       1    3     1    1
        56. mean: 454; median: 463.5; mode: 500  57. mean: 619.17; median: 647.5; mode: 327  58.  59.  60.  61.
                                                                       4    8     4    8
        Chapter 7 Test  1. $225  2. 3rd week; $350 3. $1100  4. June,August, September  5. February; 3 cm 6. March and November
        7.      Most Common Blood Types  8. 2.25%  9. 2000, 2005, 2006, 2008  10. 1998–1999, 1999–2000, 2002–2003, 2003–2004, 2004–2005,
                by Percent in the Population
             40                               17     31
                                   2007–2008  11.  40  12.  22  13. 6,211,500 people 14. 18,937,500 people 15. 9 students
             30
           Percent of  Population  20  16. 11 students  17.  Class Interval  Tally  (Number of Students)  18.  8 6
                                                                      Class Frequency
             10
                                                     (Scores)
                                                     40–49      |         1              Number of  Students  4
                O  A  B  O  A  AB  B  AB                                                   2
                    Blood Types                      50–59     | | |      3
                                                                                             40–49  50–59  60–69  70–79  80–89  90–99
                                                     60–69     | | | |    4
                                                                                              Scores
                                                     70–79     | | | |    5
                                                     80–89    | | | | |||  8                                        Copyright 2012 Pearson Education, Inc.
                                                     90–99     | | | |    4
        19. mean: 38.4; median: 42; no mode  20. mean: 12.625; median: 12.5; mode: 12 and 16 21. 3.07
   777   778   779   780   781   782   783   784   785   786   787