
Page 313 - Essencials of Sociology
P. 313
286 CHAPTER 9 Race and Ethnicity
Cultural Diversity in the United States
Glimpsing the Future: The Shifting
U.S. Racial–Ethnic Mix
During the next twenty-five years, the population of the
United States is expected to grow by about 22 percent. To
see what the U.S. population will look like at that time, can we
simply add 22 percent to our current racial–ethnic mix? The
answer is a resounding no. As you can see from Figure 9.10,
some groups will grow much more than others, giving us a
different-looking United States. Some of the changes in the
U.S. racial–ethnic mix will be dramatic. In twenty-five years,
one of every nineteen Americans is expected to have an Use the conflict perspective to identify the groups that are
Asian background, and, in the most dramatic change, about likely to be threatened by this change. Over what resources
one of four is expected to be of Latino ancestry. are struggles likely to develop? What impact do you think
The basic causes of this fundamental shift are the racial– this changing mix might have on European Americans? On
ethnic groups’ different rates of immigration and birth. Both Latinos? On African Americans? On Asian Americans? On Na-
will change the groups’ proportions of the U.S. population, tive Americans? What changes in immigration laws (or their
but immigration is by far the more important. From enforcement) can you anticipate?
Figure 9.10, you can see that the proportion of non-Hispanic To apply the symbolic interactionist perspective, con-
whites is expected to shrink, that of African Americans and sider how groups might perceive one another differently
Native Americans to remain about the same, and that of as their proportions of the population change. How do you
Latinos to increase sharply. think that these changed perceptions will affect people’s
behavior?
To apply the functionalist perspective, try to determine
For Your Consideration how each racial–ethnic group will benefit from this changing
This shifting racial–ethnic mix is one of the most significant mix. How will other parts of society (such as businesses) ben-
↑
events occurring in the United States. To better understand its efit? What functions and dysfunctions can you anticipate for
implications, apply the three theoretical perspectives. politics, economics, education, or religion?
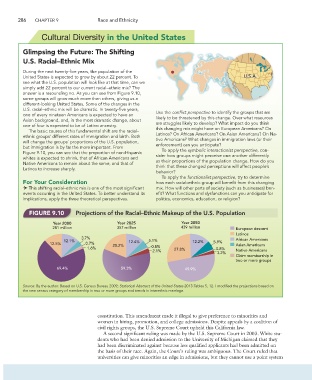
FIGURE 9.10 Projections of the Racial–Ethnic Makeup of the U.S. Population
Year 2000 Year 2025 Year 2050
281 million 357 million 439 million European descent
Latinos
3.7%
12.1% 12.4% 5.1% 12.2% 5.9% African Americans
12.5% 0.7% 20.2% Asian Americans
1.6% 0.8% 27.8% 0.8%
2.1% Native Americans
3.2%
Claim membership in
two or more groups
69.4% 59.3% 49.9%
Source: By the author. Based on U.S. Census Bureau 2009; Statistical Abstract of the United States 2013:Tables 5, 12. I modified the projections based on
the new census category of membership in two or more groups and trends in interethnic marriage.
constitution. This amendment made it illegal to give preference to minorities and
women in hiring, promotion, and college admissions. Despite appeals by a coalition of
civil rights groups, the U.S. Supreme Court upheld this California law.
A second significant ruling was made by the U.S. Supreme Court in 2003. White stu-
dents who had been denied admission to the University of Michigan claimed that they
had been discriminated against because less qualified applicants had been admitted on
the basis of their race. Again, the Court’s ruling was ambiguous. The Court ruled that
universities can give minorities an edge in admissions, but they cannot use a point system