
Page 354 - Essencials of Sociology
P. 354
The Conflict Perspective 327
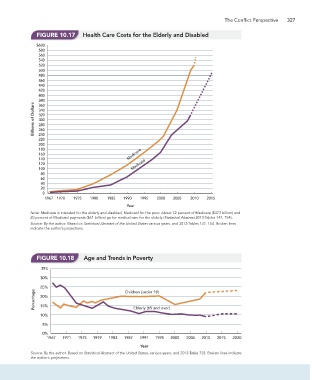
FIGURE 10.17 Health Care Costs for the Elderly and Disabled
$600
580
560
540
520
500
480
460
440
420
400
380
Billions of Dollars 340
360
320
300
280
260
240
220
200
180
160 Medicare
140
120 Medicaid
100
80
60
40
20
0
1967 1970 1975 1980 1985 1990 1995 2000 2005 2010 2015
Year
Note: Medicare is intended for the elderly and disabled, Medicaid for the poor. About 72 percent of Medicare ($373 billion) and
20 percent of Medicaid payments ($61 billion) go for medical care for the elderly (Statistical Abstract 2013:Tables 147, 154).
Source: By the author. Based on Statistical Abstract of the United States various years, and 2013:Tables 147, 154. Broken lines
indicate the author’s projections.
FIGURE 10.18 Age and Trends in Poverty
35%
30%
25% Children (under 18)
Percentage 20%
15%
10% Elderly (65 and over)
5%
0%
1967 1971 1975 1979 1983 1987 1991 1995 2000 2005 2010 2015 2020
Year
Source: By the author. Based on Statistical Abstract of the United States, various years, and 2013:Table 725. Broken lines indicate
the author’s projections.