Page 4 - Tableros al 13-ene-19
P. 4

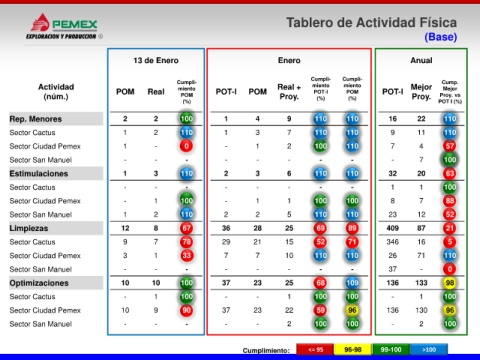
Tablero de Actividad Física

                                                                                                                                (Base)


                                         13 de Enero                                Enero                                   Anual


                                                                                              Cumpli-   Cumpli-
                                                      Cumpli-                                                                         Cump.
            Actividad                                 miento                        Real +     miento   miento              Mejor     Mejor
              (núm.)                POM      Real      POM        POT-I     POM      Proy.     POT-I     POM        POT-I    Proy.   Proy. vs
                                                                                                          (%)
                                                                                                (%)
                                                        (%)                                                                          POT I (%)
    Rep. Menores                      2        2       100          1         4        9       110       110          16      22      110
    Sector Cactus                     1        2       110          1         3        7       110       110          9       11      110

    Sector Ciudad Pemex               1        -        0            -        1        2       100       110          7        4       57
    Sector San Manuel                 -        -         -           -        -        -         -        -            -       7      100

    Estimulaciones                    1        3       110          2         3        6       110       110          32      20       63
    Sector Cactus                     -        -         -           -        -        -         -        -           1        1      100

    Sector Ciudad Pemex               -        1       100           -        1        1       100       100          8        7       88

    Sector San Manuel                 1        2       110          2         2        5       110       110          23      12       52
    Limpiezas                        12        8        67          36       28        25       69        89         409      87       21

    Sector Cactus                     9        7        78          29       21        15       52        71         346      16       5
    Sector Ciudad Pemex               3        1        33          7         7        10      110       110          26      71      110

    Sector San Manuel                 -        -         -           -        -        -         -        -           37       -       0
    Optimizaciones                   10        10      100          37       23        25       68       109         136      133      98

    Sector Cactus                     -        1       100           -        -        1       100       100           -       1      100
    Sector Ciudad Pemex              10        9        90          37       23        22       59        96         136      130      96

    Sector San Manuel                 -        -         -           -        -        2       100       100           -       2      100


                                                                          Cumplimiento:       <= 95     96-98      99-100       >100
   1   2   3   4   5