
Page 68 - BJS Vol 33 & 34
P. 68
58 Bangladesh J. Sugarcane, 33 & 34 : 54-60 August, 2013
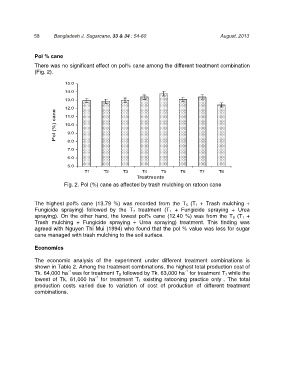
Pol % cane
There was no significant effect on pol% cane among the different treatment combination
(Fig. 2).
15.0
14.0
13.0
12.0
Pol (%) cane 10.0
11.0
9.0
8.0
7.0
6.0
5.0
T1 T2 T3 T4 T5 T6 T7 T8
Treatments
Fig. 2. Pol (%) cane as affected by trash mulching on ratoon cane
The highest pol% cane (13.79 %) was recorded from the T 5 (T 1 + Trash mulching +
Fungicide spraying) followed by the T 7 treatment (T 1 + Fungicide spraying + Urea
spraying). On the other hand, the lowest pol% cane (12.40 %) was from the T 8 (T 1 +
Trash mulching + Fungicide spraying + Urea spraying) treatment. This finding was
agreed with Nguyen Thi Mui (1994) who found that the pol % value was less for sugar
cane managed with trash mulching to the soil surface.
Economics
The economic analysis of the experiment under different treatment combinations is
shown in Table 2. Among the treatment combinations, the highest total production cost of
-1
-1
Tk. 64,000 ha was for treatment T 8 followed by Tk. 63,000 ha for treatment T 7 while the
-1
lowest of Tk. 61,000 ha for treatment T 1 existing ratooning practice only . The total
production costs varied due to variation of cost of production of different treatment
combinations.