
Page 118 - BJS vol. 36
P. 118
110 Bangladesh J. Sugarcane, 36 : 105-112 June, 2015
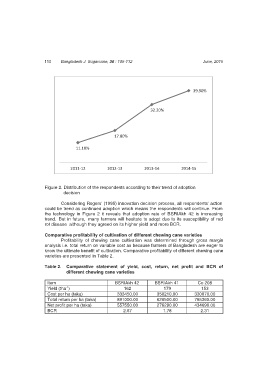
39.90%
32.20%
17.80%
11.10%
2011-12 2012-13 2013-14 2014-15
Figure 2. Distribution of the respondents according to their trend of adoption
decision
Considering Rogers' (1995) innovation decision process, all respondents' action
could be trend as continued adoption which means the respondents will continue. From
the technology in Figure 2 it reveals that adoption rate of BSRIAkh 42 is increasing
trend. But in future, many farmers will hesitate to adopt due to its susceptibility of red
rot disease although they agreed on its higher yield and more BCR.
Comparative profitability of cultivation of different chewing cane varieties
Profitability of chewing cane cultivation was determined through gross margin
analysis i.e. total return on variable cost as because farmers of Bangladesh are eager to
know the ultimate benefit of cultivation. Comparative profitability of different chewing cane
varieties are presented in Table 2.
Table 2. Comparative statement of yield, cost, return, net profit and BCR of
different chewing cane varieties
Item BSRIAkh 42 BSRIAkh 41 Co 208
Yield (tha ) 162 179 153
-1
Cost per ha (taka) 333450.00 350210.00 330670.00
Total return per ha (taka) 891000.00 626500.00 765360.00
Net profit per ha (taka) 557550.00 276290.00 434690.00
BCR 2.67 1.78 2.31