
Page 100 - BJS vol. 35
P. 100
92 Bangladesh J. Sugarcane, 35 : 88-95 June, 2014
From the figoore 4, we observed that there was no significant difference in pH of
prepared goor from all the treatments. Lower pH indicates acidic in nature. Figure 4
shows that the highest pH value of goor prepared from the treatment T 2 (5.79) followed
by the treatment T 3 (5.61), respectively and prepared goor from these treatments are
suitable for consumption. This result agreed with Arefin et al. (2010). Figure 5
mentioned that there was no significant difference in moisture% of prepared goor from all
the treatments. The highest moisture% and the lowest moisture% obtained from the
treatment T 3 (7.91%) and the treatment T 2 (7.15%). Higher percentage of moisture
containing goor is not suitable for long term preservation (Gaur et. al., 1979). Figure 6
stated that the highest recovery% of goor was obtained from the treatment T 2 (10.15%)
which is statistically similar to the other treatments.
On the basis of above results, it may be stated that superior quality of goor
associated with higher sucrose, high colour transmittance, lower reducing sugars content,
low moisture content and high goor recovery. The correct proportion of this parameter is
essential for producing good quality goor with standard keeping quality. From the
observed physical and chemical properties of goor, it may be concluded that the the
treatment T 2 (Powder phyto clarificant 30 g/100 L cane juice) was found better result for
juice clarification and produce lucrative colour and better quality goor (Figure 7).
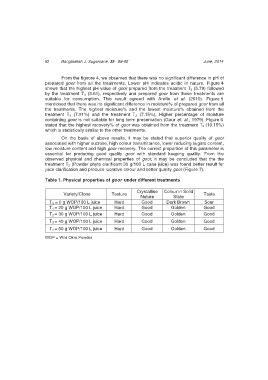
Table 1. Physical properties of goor under different treatments
Crystalline Colour in Solid
Variety/Clone Texture Taste
Nature State
T 0 = 0 g WOP/100 L juice Hard Good Dark Brown Sour
T 1 = 20 g WOP/100 L juice Hard Good Golden Good
T 2 = 30 g WOP/100 L juice Hard Good Golden Good
T 3 = 40 g WOP/100 L juice Hard Good Golden Good
T 4 = 50 g WOP/100 L juice Hard Good Golden Good
WOP = Wild Okra Powder