Page 134 - BJS vol. 35
P. 134

126    Bangladesh J. Sugarcane, 35 : 124-130                          June, 2014


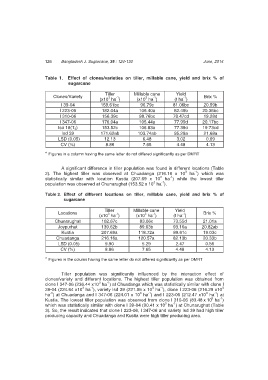
                     Table  1.    Effect  of  clones/varieties  on  tiller,  millable  cane,  yield  and  brix  %  of
                               sugarcane

                                                Tiller       Millable cane     Yield
                         Clones/Variety          3   -1           3  -1            -1       Brix %
                                             (x10  ha )       (x10  ha )       (t ha )
                            I 39-04           159.61bc         96.79c         81.06bc      20.59b
                            I 223-06          182.04a          106.40a        82.49b       20.36bc
                            I 310-06          156.39c          98.76bc        78.47cd      19.28d
                            I 347-06          176.04a          105.44a        77.99d       20.17bc
                           Isd 18(T 2 )       153.52c          106.83a        77.39d       19.73cd
                            Isd 39            171.62ab        103.74ab        95.29a       21.68a
                           LSD (0.05)          12.13            6.48           3.02          0.69
                            CV (%)              8.86            7.65           4.48          4.13

                     * Figures in a column having the same letter do not differed significantly as per DMRT

                            A significant difference in tiller population was found in different locations (Table
                                                                                       -1
                                                                                   3
                     2).  The  highest  tiller  was  observed  at  Chuadanga  (216.16  x  10   ha )  which  was
                                                                            -1
                                                                        3
                     statistically  similar  with  location  Kustia  (207.69  x  10   ha )  while  the  lowest  tiller
                                                                         -1
                                                                     3
                     population was observed at Chunarughat (153.52 x 10  ha ).

                     Table 2.  Effect  of  different  locations  on  tiller,  millable  cane,  yield  and  brix  %  of
                             sugarcane
                                               Tiller       Millable cane      Yield
                           Locations             3  -1           3   -1           -1       Brix %
                                             (x10  ha )      (x10  ha )       (t ha )
                         Chunarughat          102.67c          83.06c         73.55d       21.01a
                           Joypurhat          139.62b          89.63b         93.16a       20.82ab
                            Kustia            207.69a         118.72a         89.61c       19.03c
                          Chuadanga           216.16a         120.57a         82.13b       20.33b
                           LSD (0.05)           9.90            5.29           2.47         0.56
                            CV (%)              8.86            7.65           4.48         4.13

                     * Figures in the column having the same letter do not differed significantly as per DMRT

                            Tiller  population  was  significantly  influenced  by  the  interaction  effect  of
                     clones/variety  and  different  locations.  The  highest  tiller  population  was  obtained  from
                                                -1
                                             3
                     clone I 347-06 (236.44 x10  ha ) at Chuadanga which was statistically similar with clone I
                                                                     3
                                                                                                    3
                                         -1
                                      3
                                                                        -1
                     39-04 (224.64 x10  ha ), variety Isd 39 (221.05 x 10  ha ), clone I 223-06 (216.29 x10
                                                                                                -1
                                                                                             3
                       -1
                                                                   -1
                                                               3
                     ha ) at Chuadanga and I 347-06 (224.01 x 10  ha ) and I 223-06 (212.47 x10  ha ) at
                                                                                                   -1
                                                                                               3
                     Kustia. The lowest tiller population was observed from clone I 310-06 (83.48 x 10  ha )
                                                                              -1
                                                                          3
                     which was statistically similar with clone I 39-04 (90.41 x 10  ha ) at Chunarughat (Table
                     3). So, the result indicated that clone I 223-06, I 347-06 and variety Isd 39 had high tiller
                     producing capacity and Chuadanga and Kustia were high tiller producing area.
   129   130   131   132   133   134   135   136   137   138   139