
Page 144 - BJS vol. 35
P. 144
136 Bangladesh J. Sugarcane, 35 : 131-137 June, 2014
The coefficient of frequency of the extension contact is negative and significant, which
indicated that the farmers were technically more efficient that who make frequent contact
with the extension personnel than the farmers who do not contact frequently. Similarly,
the negative and significant coefficient of farm size is indicated that larger farmers are
more efficient than small farmers and this is similar to Hoassain (2008). The coefficient of
education variable is negative, but not significant so we can not say that the educated
farmers are more efficient than the illiterate farmers. The coefficient of age variable is
negative, but not significant too, therefore, we can not say that the older farmers were not
less inefficient than the younger farmers. This result is in line with those of Hossain
(1999) and Coelli (1996). The estimated variance (2) is large and significantly different
from zero which indicated a good fit and correctness of specified assumption.
Technical Efficiency and Its Distribution
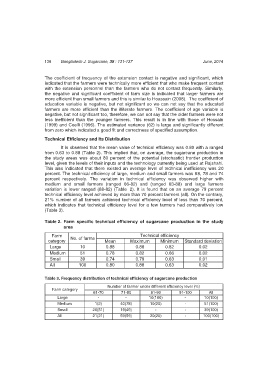
It is observed that the mean value of technical efficiency was 0.80 with a ranged
from 0.63 to 0.88 (Table 2). This implied that, on average, the sugarcane production in
the study areas was about 80 percent of the potential (stochastic) frontier production
level, given the levels of their inputs and the technology currently being used at Rajshahi.
This also indicated that there existed an average level of technical inefficiency was 20
percent. The technical efficiency of large, medium and small farmers was 88, 78 and 74
percent respectively. The variation in technical efficiency was observed higher with
medium and small farmers (ranged 66-82) and (ranged 63-88) and large farmers
variation is lower ranged (88-82) (Table 2). It is found that on an average 79 percent
technical efficiency level achieved by more than 70 percent farmers (all). On the contrary,
21% number of all farmers achieved technical efficiency level of less than 70 percent,
which indicates that technical efficiency level for a few farmers had comparatively low
(Table 3).
Table 2. Farm specific technical efficiency of sugarcane production in the study
area
Farm No. of farms Technical efficiency
category Mean Maximum Minimum Standard deviation
Large 10 0.88 0.88 0.82 0.02
Medium 51 0.78 0.82 0.66 0.02
Small 39 0.74 0.79 0.63 0.01
All 100 0.80 0.88 0.63 0.02
Table 3. Frequency distribution of technical efficiency of sugarcane production
Number of farmer under different efficiency level (%)
Farm category
61-70 71-80 81-90 91-100 All
Large - - 10(100) - 10(100)
Medium 1(2) 40(78) 10(20) - 51(100)
Small 20(51) 19(49) - - 39(100)
All 21(21) 59(59) 20(20) - 100(100)