
Page 40 - BJS vol. 35
P. 40
32 Bangladesh J. Sugarcane, 35 : 28-36 June, 2014
sucrose% and top weight. Kumar and Kumar (2014) also reported similar result in
sugarcane.
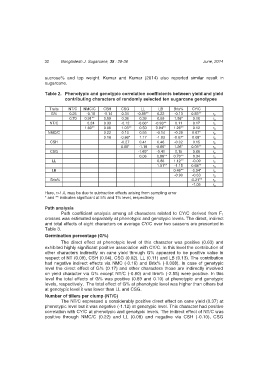
Table 2. Phenotypic and genotypic correlation coefficients between yield and yield
contributing characters of randomly selected ten sugarcane genotypes
Traits NT/C NMC/C CSH CSG LL LB Brix% CY/C
G% 0.25 -0.18 -0.14 0.34 -0.89** 0.22 -0.13 0.89** r p
0.70 0.91** 0.59 0.36 0.39 0.69 1.58* 0.10 r g
NT/C 0.24 0.33 -0.12 -0.66* -0.93** 0.11 0.17 r p
1.60** 0.06 1.03** 0.50 0.94** 1.26** 0.12 r g
NMC/C 0.22 0.10 0.55 -0.14 -0.29 0.67* r p
0.18 -0.86* 1.17 -1.03 -0.67* 0.08* r g
CSH -0.27 0.41 0.46 -0.02 0.15 r p
0.88* -1.19 -0.66* 1.26* 0.09** r g
CSG -1.69* -0.41 0.15 0.06 r p
0.06 0.88** 0.70** 0.34 r g
LL 0.86 1.12** -0.09 r p
1.01** -1.15 0.68** r g
LB 0.46** -0.04* r p
-0.90 -0.63 r g
Brix% -0.21** r p
-1.05 r g
Here, r>1.0, may be due to subtraction effects arising from sampling error
* and ** indicates significant at 5% and 1% level, respectively
Path analysis
Path coefficient analysis among all characters related to CY/C derived from F 1
crosses was estimated separately at phenotypic and genotypic levels. The direct, indirect
and total effects of eight characters on average CY/C over two seasons are presented in
Table 3.
Germination percentage (G%)
The direct effect at phenotypic level of this character was positive (0.63) and
exhibited highly significant positive association with CY/C. In this level the contribution of
other characters indirectly on cane yield through G% appeared to be positive value in
respect of NT (0.09), CSH (0.04), CSG (0.02), LL (0.11) and LB (0.13). The contribution
had negative indirect effects via NMC (-0.16) and Brix% (-0.008). In case of genotypic
level the direct effect of G% (0.17) and other characters those are indirectly involved
on yield character via G% except NT/C (-0.80) and Brix% (-2.55) were positive. In this
level the total effects of G% was positive (0.89 and 0.10) at phenotypic and genotypic
levels, respectively. The total effect of G% at phenotypic level was higher than others but
at genotypic level it was lower than LL and CSG.
Number of tillers per clump (NT/C)
The NT/C expressed a considerably positive direct effect on cane yield (0.37) at
phenotypic level but it was negative (-1.12) at genotypic level. This character had positive
correlation with CY/C at phenotypic and genotypic levels. The indirect effect of NT/C was
positive through NMC/C (0.22) and LL (0.08) and negative via CSH (-0.10), CSG