Page 93 - BJS vol. 35
P. 93

Site Specific Fertilizer Requirement of Sugarcane and Potato as ...... System   85


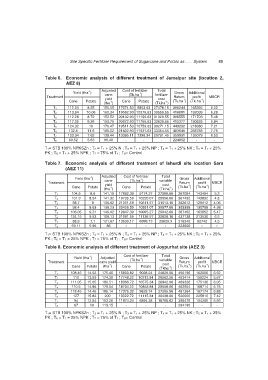
                     Table 6.   Economic  analysis  of  different  treatment  of  Jamalpur  site  (location  2,
                              AEZ 8)

                                        -1
                                 Yield (tha )   Adjusted   Cost of fertilizer    Total   Gross   Additional
                                                               -1
                      Treatment                 cane      (Tk.ha )    fertilizer   Return   profit   MBCR
                                                                       cost
                                                yield
                                                                                          -1
                                                                                  -1
                                Cane   Potato   (tha )   Cane   Potato   (Tk.ha )  (Tk.ha )  (Tk.ha )
                                                                          -1
                                                  -1
                         T 1   112.04   8.25   150.09   17674.53  9803.63  27478.15  390244   165392   6.02
                         T 2   113.94   10.06   160.34   19582.93  10976.63  30559.55  416891   192039   6.28
                         T 3   112.28   8.72   152.52   20132.93  11196.63  31329.55  396555   171703   5.48
                         T 4   117.05   9.26   159.76   20872.93  11766.63  32639.55  415377   190525   5.84
                         T 5   124.32    10    170.47   19511.53  10759.63  30271.15  443232   218380   7.21
                         T 6    132.5   11.6   186.02   21422.93  11931.63  33354.55  483640   258788   7.76
                         T 7   103.04   7.62   138.44   13395.11  7396.34  20791.45  359931   135079   6.50
                         T 8    60.52   5.63   86.48     -       -      -     224852    -       -
                     T 1= STB 100% NPKSZn ; T 2 = T 1 + 25% N ; T 3 = T 1 + 25% NP ; T 4 = T 1 + 25% NK ; T 5 = T 1 + 25%
                     PK ; T 6 = T 1 + 25% NPK ; T 7 = 75% of T 1 ; T 8= Control

                     Table 7.   Economic  analysis  of  different  treatment  of  Ishurdi  site  location  Sara
                              (AEZ 11)
                                                                         Total
                                         -1
                                  Yield (tha )   Adjusted   Cost of fertilizer    variable   Gross   Additional
                                                               -1
                                                           (Tk.ha )
                                                cane
                      Treatment                 yield                    cost    Return   profit   MBCR
                                                                                     -1
                                                                                             -1
                                 Cane   Potato    -1   Cane     Potato      -1  (Tk.ha )  (Tk.ha )
                                               (tha )                   (Tk.ha )
                         T 1     104.5   8.6   141.19   17892.39   9174.27   27066.66   367094   143494   5.3
                         T 2     101.9   8.54   141.32   19736.59   10220.07   29956.66   367432   143832   4.8
                         T 3     98.7     8    135.62   21001.59   10811.57   31813.16   352612   129012   4.06
                         T 4     98.4    8.63   138.23   20426.59   10551.07   30977.66   359398   135798   4.38
                         T 5    106.05   9.31   149.02   19847.39   10095.27   29942.66   387452   163852   5.47
                         T 6    124.15   9.53   168.13   21691.59   11136.57   32828.16   437138   213536   6.5
                         T 7     88.9    7.1   121.67   13630.17   6999.13   20629.3   316342   92742   4.5
                         T 8     59.11   5.96   86       -        -       -     223600     -     -
                     T 1= STB 100% NPKSZn ; T 2 = T 1 + 25% N ; T 3 = T 1 + 25% NP ; T 4 = T 1 + 25% NK ; T 5 = T 1 + 25%
                     PK ; T 6 = T 1 + 25% NPK ; T 7 = 75% of T 1 ; T 8= Control

                     Table 8. Economic analysis of different treatment of Joypurhat site (AEZ 3)
                                         -1
                                  Yield (tha )   Adjusted   Cost of fertilizer    Total   Gross   Additional
                                                               -1
                      Treatment              cane yield    (Tk.ha )     variable   Return   profit   MBCR
                                                                         cost
                                                                                     -1
                                                                                             -1
                                                 -1
                                 Cane   Potato   (tha )   Cane   Potato   (Tkha )   (Tk.ha )  (Tk.ha )
                                                                            -1
                         T 1    108.45   14.52   175.46   15800.82   9028.24   24829.06   456196   162006   6.52
                         T 2     110    13.93   174.39   17748.22   10313.84   28062.06   453414   159224   5.67
                         T 3    111.05   15.05   180.51   18366.72   10575.34   28942.06   469326   175136   6.05
                         T 4     110.5   14.85   179.04   18704.22   10853.84   29558.06   462904   168714   5.75
                         T 5    118.45   14.45   185.14   17375.32   9829.74   27205.06   481364   187174   6.88
                         T 6     127    15.82   200   19322.72   11115.34   30438.06   520000   225810   7.42
                         T 7      94    12.84   153.26   11874.24   6894.38   18768.62   398476   104286   5.56
                         T 8      67     10   113.15     -        -       -     294190     -     -
                     T 1= STB 100% NPKSZn ; T 2 = T 1 + 25% N ; T 3 = T 1 + 25% NP ; T 4 = T 1 + 25% NK ; T 5 = T 1 + 25%
                     PK ; T 6 = T 1 + 25% NPK ; T 7 = 75% of T 1 ; T 8= Control
   88   89   90   91   92   93   94   95   96   97   98