
Page 23 - ingenieria financiera
P. 23
equipo nuevo equipo viejo
inversion años % ingreso gastos ingreso gastos
9000 5 20% 40000 30000 35000
41000 30000 35000
1800 42000 30000 35000
beneficio % 43000 30000 35000
1 20% 1800 44000 30000 35000
2 32% 2880
3 19% 1710
4 12% 1080
5 12% 1080
6 5% 450
9000
equipo nuevo
inversion años %
11000 5 20%
2200
beneficio %
1 20% 2200
2 32% 3520
3 19% 2090
4 12% 1320
5 12% 1320
6 5% 550
11000
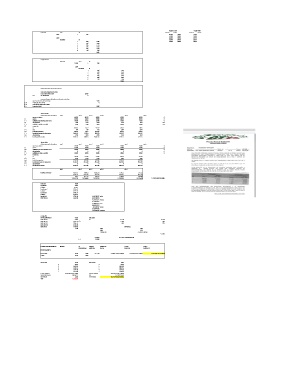
determinacion de la inversion inicial
costo de instalacion del activo
costos del activo nuevo 11000
(+) cto instalacion 0
ingresos despues obtenidos por la venta activo fijo
ingresos de venta del activo fijo 5000
(+/-) impuestos de la venta 0
(+/-) cambios del capital de trabajo
(=) inversion inicial 6000
torno nuevo
determinacion de beneficios año 1 año 2 año 3 año 4 año 5 año 6
ingresos y ahorro 40000 41000 42000 43000 44000 0
(-) gastos 30000 30000 30000 30000 30000 0
(=) utilidad antes depreciacion e imp 10000 11000 12000 13000 14000 0
(-) depreciacion 2200 3520 2090 1320 1320 550
(=) utilidad gravable o perdida 7800 7480 9910 11680 12680 -550
(-) impuestos
isr 188.18 167.7 323.22 436.5 500.5
(+) ptu 780 748 991 1168 1268
(=) total de impuestos 968.18 915.7 1314.22 1604.5 1768.5
(=) beneficio despues de impuestos 6831.82 6564.3 8595.78 10075.5 10911.5
(+) depreciacion 2200 3520 2090 1320 1320
(=) beneficio del periodo 9031.82 10084.3 10685.78 11395.5 12231.5
torno viejo
determinacion de beneficios año 1 año 2 año 3 año 4 año 5 año 6
ingresos y ahorro 35000 35000 35000 35000 35000 0
(-) gastos 25000 25000 25000 25000 25000 0
(=) utilidad antes depreciacion e imp 10000 10000 10000 10000 10000 0
(-) depreciacion 0 0 0 0 0 0
(=) utilidad gravable o perdida 10000 10000 10000 10000 10000 0
(-) impuestos
isr 328.98 328.98 328.98 328.98 328.98
(+) ptu 1000 1000 1000 1000 1000
(=) total de impuestos 1328.98 1328.98 1328.98 1328.98 1328.98
(=) beneficio despues de impuestos 8671.02 8671.02 8671.02 8671.02 8671.02
(+) depreciacion 0 0 0 0 0
(=) beneficio del periodo 8671.02 8671.02 8671.02 8671.02 8671.02
año 1 año 2 año 3 año 4 año 5
beneficio relevante 9031.82 10084.3 10685.78 11395.5 12231.5
8671.02 8671.02 8671.02 8671.02 8671.02
360.8 1413.28 2014.76 2724.48 3560.48
1.920732% 1.919648% 1.919832% 1.919999% 1.919966% 1.9200353042142000%
inversion 6000
beneficio 1 360.8
faltante 5639.2
beneficiio 2 1413.28
faltante 4225.92
beneficio 3 2014.76
faltante 2211.16
beneficio 4 2724.48 3.811589735 años
BENEFICIO 5 3560.48 0.811589735
9.739076815 meses
0.739076815
22.48025311 dias
0.480253113
11.5260747 horas
0.526074701
31.56448203 minutos
calculo TIR
INVERSION INICIAL -6000 MAS BAJA
BENEFICIO 1 360.8 TIE 8.12% 8.12%
BENEFICIO 2 1413.28 (+) 5.50% 24%
BENEFICIO 3 2014.76 14% 32%
BENEFICIO 4 2724.48
BENEFICIO 3560.48 ENTONCES
15% ALTA 14%
BAJA 32%
PROMEDIO 22.865% SIN IVA
3.658%
22.865% 26.523% TASA PROMEDIO
(+) 3.658%
FUENTES FINANCIAMINETO MONTO % COSTOS BENEFICIO COSTO COSTO
PROPORCION ANTES ISR FISCAL DESPS ISR CAPÍTAL PP
FINANCIAMINETO
PRESTAMO 6000 100% 26.523% 1.9200353042142000% 26.014141356122100% 26.014141356122100%
SUMA 6000 100%
INVERSION 6000 INVERSION -6000
1 360.8 1 360.8
2 1413.28 2 1413.28
3 2014.76 3 2014.76
4 2724.48 4 2724.48
5 3560.48 5 3560.48
COSTO CAPITAL 26.014141356122100% COSTO CAPITAL 26.014141356122100%
VALOR PRESENTE $4,384.12 TIR 15.18811155%
INV INICIAL 6000 DIFERENCIA -10.826029806840400%
VNP -$1,615.88