
Page 48 - tmp_Neat
P. 48
addition, information on traffic volume and road features (e.g. road division marking) was
extracted from the Australian Urban Research Infrastructure Network Portal (AURIN).
Data on the neighbourhood socio-demographic characteristics at the postcode level were
extracted from the Australian Bureau of Statistic (ABS). The ABS census collects social,
economic and demographic information, such as education, English language proficiency,
occupation, income, and birthplace, etc. The data were matched to the postcodes of the driver
licenses and the crash locations provided in the police crash reports. It should be noted that
about 12% of the observations had the same postcodes for both the road user residency and
the crash location, indicating that 88% of crashes did not occur in the same postcode where
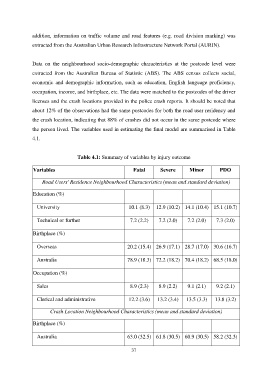
the person lived. The variables used in estimating the final model are summarised in Table
4.1.
Table 4.1: Summary of variables by injury outcome
Variables Fatal Severe Minor PDO
Road Users' Residence Neighbourhood Characteristics (mean and standard deviation)
Education (%)
University 10.1 (8.3) 12.9 (10.2) 14.1 (10.4) 15.1 (10.7)
Technical or further 7.2 (2.2) 7.2 (2.0) 7.2 (2.0) 7.3 (2.0)
Birthplace (%)
Overseas 20.2 (15.4) 26.9 (17.1) 28.7 (17.0) 30.6 (16.7)
Australia 78.9 (18.3) 72.2 (18.2) 70.4 (18.2) 68.5 (18.0)
Occupation (%)
Sales 8.9 (2.3) 8.9 (2.2) 9.1 (2.1) 9.2 (2.1)
Clerical and administrative 12.2 (3.6) 13.2 (3.4) 13.5 (3.3) 13.8 (3.2)
Crash Location Neighbourhood Characteristics (mean and standard deviation)
Birthplace (%)
Australia 63.0 (32.5) 61.8 (30.5) 60.9 (30.5) 58.2 (32.3)
37