
Page 91 - tmp_Neat
P. 91
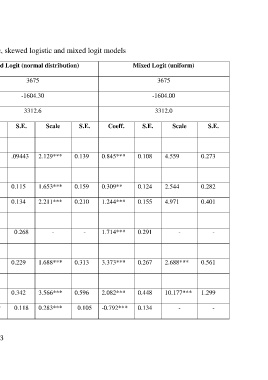
Table 5.2: Estimates for standard logistic, skewed logistic and mixed logit models

    Standard Logistic   Skewed Logistic   Mixed Logit (normal distribution)   Mixed Logit (uniform)

 Observation   3675   3675   3675                 3675

 Log-likelihood function   -1622.97   -1620.85   -1604.30   -1604.00

 AIC   3297.9   3295.7   3312.6                   3312.0

 Variable   Coeff.   S.E.   Coeff.   S.E   Coeff.   S.E.   Scale   S.E.   Coeff.   S.E.   Scale   S.E.

 Occupant Gender

      Female   0.823***   0.095   0.625***   0.115   0.688***   .09443   2.129***   0.139   0.845***   0.108   4.559   0.273

 Occupant Age

     16-24   0.329***   0.116   0.246*   0.095   0.148   0.115   1.653***   0.159   0.309**   0.124   2.544   0.282

     65+   1.017***   0.132   0.782***   0.148   0.986***   0.134   2.211***   0.210   1.244***   0.155   4.971   0.401

 Safety restraint

     No    1.135***   0.269   0.856***   0.259   1.396***   0.268   -   -   1.714***        0.291        -   -

 Ejected

     Yes    2.148***   0.222   1.689***   0.267  2.675***   0.229   1.688***   0.313   3.373***   0.267      2.688***        0.561

 Vehicle type
     Motorcycle   0.880***   0.308   0.757***   0.244  1.421***   0.342   3.566***   0.596   2.082***   0.448   10.177***   1.299


     Heavy vehicle   -0.417***   0.131   -0.321***   0.105   -0.616***   0.118   0.283***   0.105   -0.792***   0.134   -   -


 73