
Page 22 - 2017 INVESTMENT PHILOSOPHY - May 2017
P. 22
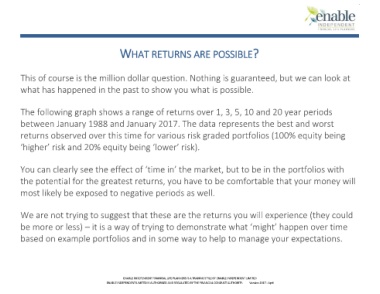
WHAT RETURNS ARE POSSIBLE?


          This of course is the million dollar question. Nothing is guaranteed, but we can look at

          what has happened in the past to show you what is possible.


          The following graph shows a range of returns over 1, 3, 5, 10 and 20 year periods

          between January 1988 and January 2017. The data represents the best and worst

          returns observed over this time for various risk graded portfolios (100% equity being

          ‘higher’ risk and 20% equity being ‘lower’ risk).


          You can clearly see the effect of ‘time in’ the market, but to be in the portfolios with

          the potential for the greatest returns, you have to be comfortable that your money will

          most likely be exposed to negative periods as well.


          We are not trying to suggest that these are the returns you will experience (they could

          be more or less) – it is a way of trying to demonstrate what ‘might’ happen over time

          based on example portfolios and in some way to help to manage your expectations.


                                                    ENABLE INDEPENDENT FINANCIAL LIFE PLANNERS IS A TRADING STYLE OF ENABLE INDEPENDENT LIMITED
                                              ENABLE INDEPENDENT LIMITED IS AUTHORISED AND REGULATED BY THE FINANCIAL CONDUCT AUTHORITY.          Version 2017 - April