
Page 28 - Microsoft Word - 00 CIMA F1 Prelims STUDENT 2018.docx
P. 28
Chapter 2
Understand and
Quantifying risk assess scale of risk
5.1 Expected values
Expected value (EV) = Σ (probability × outcome).
5.2 Volatility
Simplest measure would be to look at the range of possible outcomes.
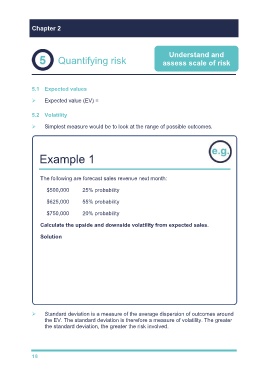
Example 1
The following are forecast sales revenue next month:
$500,000 25% probability
$625,000 55% probability
$750,000 20% probability
Calculate the upside and downside volatility from expected sales.
Solution
EV = (500,000 × 0.25) + (625,000 × 0.55) + (750,000 × 0.2) = $618,750
The volatility is the possible amount away from the expected value.
The volatility is therefore:
Downside: 618,750 – 500,000 = $118,750
Upside: 750,000 – 618,750 = $131,250
Standard deviation is a measure of the average dispersion of outcomes around
the EV. The standard deviation is therefore a measure of volatility. The greater
the standard deviation, the greater the risk involved.
18