
Page 18 - FINAL CFA II SLIDES JUNE 2019 DAY 2
P. 18
LOS 7.j: Describe the use ANOVA in regression
2
analysis, interpret results; calculate and interpret the F- MODULE 7.5: ANOVA TABLES, R , AND SEE
statistic.
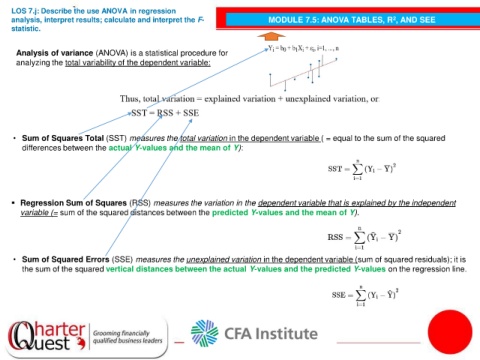
Analysis of variance (ANOVA) is a statistical procedure for
analyzing the total variability of the dependent variable:
• Sum of Squares Total (SST) measures the total variation in the dependent variable ( = equal to the sum of the squared
differences between the actual Y-values and the mean of Y):
Regression Sum of Squares (RSS) measures the variation in the dependent variable that is explained by the independent
variable (= sum of the squared distances between the predicted Y-values and the mean of Y).
• Sum of Squared Errors (SSE) measures the unexplained variation in the dependent variable (sum of squared residuals); it is
the sum of the squared vertical distances between the actual Y-values and the predicted Y-values on the regression line.