
Page 6 - FINAL CFA II SLIDES JUNE 2019 DAY 3
P. 6
READING 8: MULTIPLE REGRESSION AND ISSUES IN REGRESSION ANALYSIS
Lets return to LOS 8b: p-values
MODULE 8.2: HYPOTHESIS TESTS AND CONFIDENCE INTERVALS
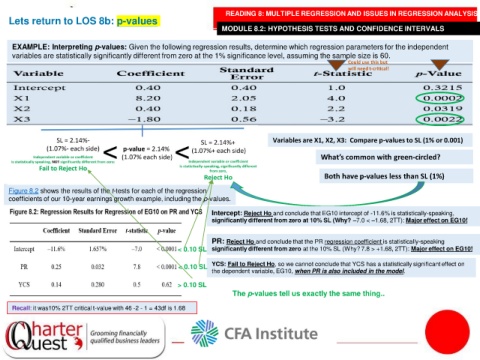
EXAMPLE: Interpreting p-values: Given the following regression results, determine which regression parameters for the independent
variables are statistically significantly different from zero at the 1% significance level, assuming the sample size is 60.
Could use this but
will need t-critical!
Variables are X1, X2, X3: Compare p-values to SL (1% or 0.001)
What’s common with green-circled?
Both have p-values less than SL (1%)
Figure 8.2 shows the results of the t-tests for each of the regression
coefficients of our 10-year earnings growth example, including the p-values.
Intercept: Reject Ho and conclude that EG10 intercept of -11.6% is statistically-speaking,
significantly different from zero at 10% SL (Why? –7.0 < –1.68, 2TT): Major effect on EG10!
PR: Reject Ho and conclude that the PR regression coefficient is statistically-speaking
< 0.10 SL significantly different from zero at the 10% SL (Why? 7.8 > +1.68, 2TT): Major effect on EG10!
< 0.10 SL YCS: Fail to Reject Ho, so we cannot conclude that YCS has a statistically significant effect on
the dependent variable, EG10, when PR is also included in the model.
> 0.10 SL
The p-values tell us exactly the same thing..
Recall: it was10% 2TT critical t-value with 46 -2 - 1 = 43df is 1.68