
Page 32 - FINAL CFA II SLIDES JUNE 2019 DAY 6
P. 32
LOS 22.l: Describe broad trends in corporate payout policies. READING 22: DIVIDENDS AND SHARE REPURCHASES: ANALYSIS
1. A lower % of U.S. firms pay dividends compared to their European counterparts.
2. % of companies paying cash dividends has trended downwards over the long term.
3. The % of companies making stock repurchases has been trending upwards in the MODULE 22.2: STOCK BUYBACKS
US since the 1980s and in the UK and continental Europe since the 1990s.
LOS 22.m: Calculate and interpret dividend coverage ratios based on 1) net income and 2) free cash flow.
LOS 22.n: Identify characteristics of companies that may not be able to sustain their cash dividend.
Dividend safety is the metric used to evaluate the probability of dividends continuing at the current rate for a company (dividend payout ratio or its
inverse dividend coverage ratio (net income/dividends), are typically used for this purpose).
• A higher than normal dividend payout ratio (and lower than normal dividend coverage ratio) tends to typically indicate a higher probability of a dividend cut (or a lower
probability of dividend sustainability).
In analyzing these ratios, we should compare ratio to the average ratio for the industry/market. In making a qualitative judgment:
• Stable or increasing dividends are looked upon favorably, whereas
• Companies that have cut their dividends in the past are looked upon unfavorably.
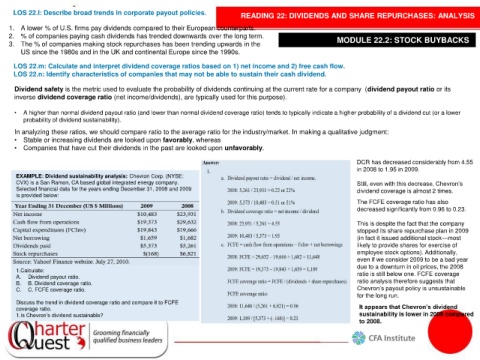
DCR has decreased considerably from 4.55
in 2008 to 1.95 in 2009.
EXAMPLE: Dividend sustainability analysis: Chevron Corp. (NYSE:
CVX) is a San Ramon, CA based global integrated energy company. Still, even with this decrease, Chevron’s
Selected financial data for the years ending December 31, 2008 and 2009 dividend coverage is almost 2 times.
is provided below:
The FCFE coverage ratio has also
decreased significantly from 0.96 to 0.23.
This is despite the fact that the company
stopped its share repurchase plan in 2009
(in fact it issued additional stock—most
likely to provide shares for exercise of
employee stock options). Additionally,
even if we consider 2009 to be a bad year
due to a downturn in oil prices, the 2008
1.Calculate: ratio is still below one. FCFE coverage
A. Dividend payout ratio.
B. B. Dividend coverage ratio. ratio analysis therefore suggests that
C. C. FCFE coverage ratio. Chevron’s payout policy is unsustainable
for the long run.
Discuss the trend in dividend coverage ratio and compare it to FCFE
coverage ratio. It appears that Chevron’s dividend
1.Is Chevron’s dividend sustainable? sustainability is lower in 2009 compared
to 2008.