
Page 248 - Microsoft Word - 00 BA3 IW Prelims STUDENT.docx
P. 248
Fundamentals of Business Economics
CHAPTER 9 – INDEX NUMBERS
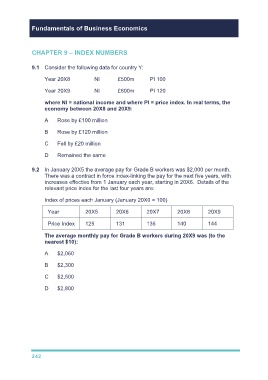
9.1 Consider the following data for country Y:
Year 20X8 NI £500m PI 100
Year 20X9 NI £600m PI 120
where NI = national income and where PI = price index. In real terms, the
economy between 20X8 and 20X9:
A Rose by £100 million
B Rose by £120 million
C Fell by £20 million
D Remained the same
9.2 In January 20X5 the average pay for Grade B workers was $2,000 per month.
There was a contract in force index-linking the pay for the next five years, with
increases effective from 1 January each year, starting in 20X6. Details of the
relevant price index for the last four years are:
Index of prices each January (January 20X0 = 100)
Year 20X5 20X6 20X7 20X8 20X9
Price Index 125 131 136 140 144
The average monthly pay for Grade B workers during 20X9 was (to the
nearest $10):
A $2,060
B $2,300
C $2,500
D $2,800
242